Quick Start Guide
Database Performance Monitor makes best-in-class database performance monitoring easy. To get you off to a fast start using some of the system’s key capabilities, we created this guide. It offers step-by-step instructions on how you can find answers to a few questions that database administrators, developers and managers face on a regular basis.
Top Use-Cases
Troubleshoot and Diagnose Outages
References
To Learn More or Contact Support
Deploy Code with Confidence
Get visibility into your database performance, based on a code deployment, so you have confidence your queries are performing as expected. Compare top queries over time, search for newly introduced queries, and validate results.
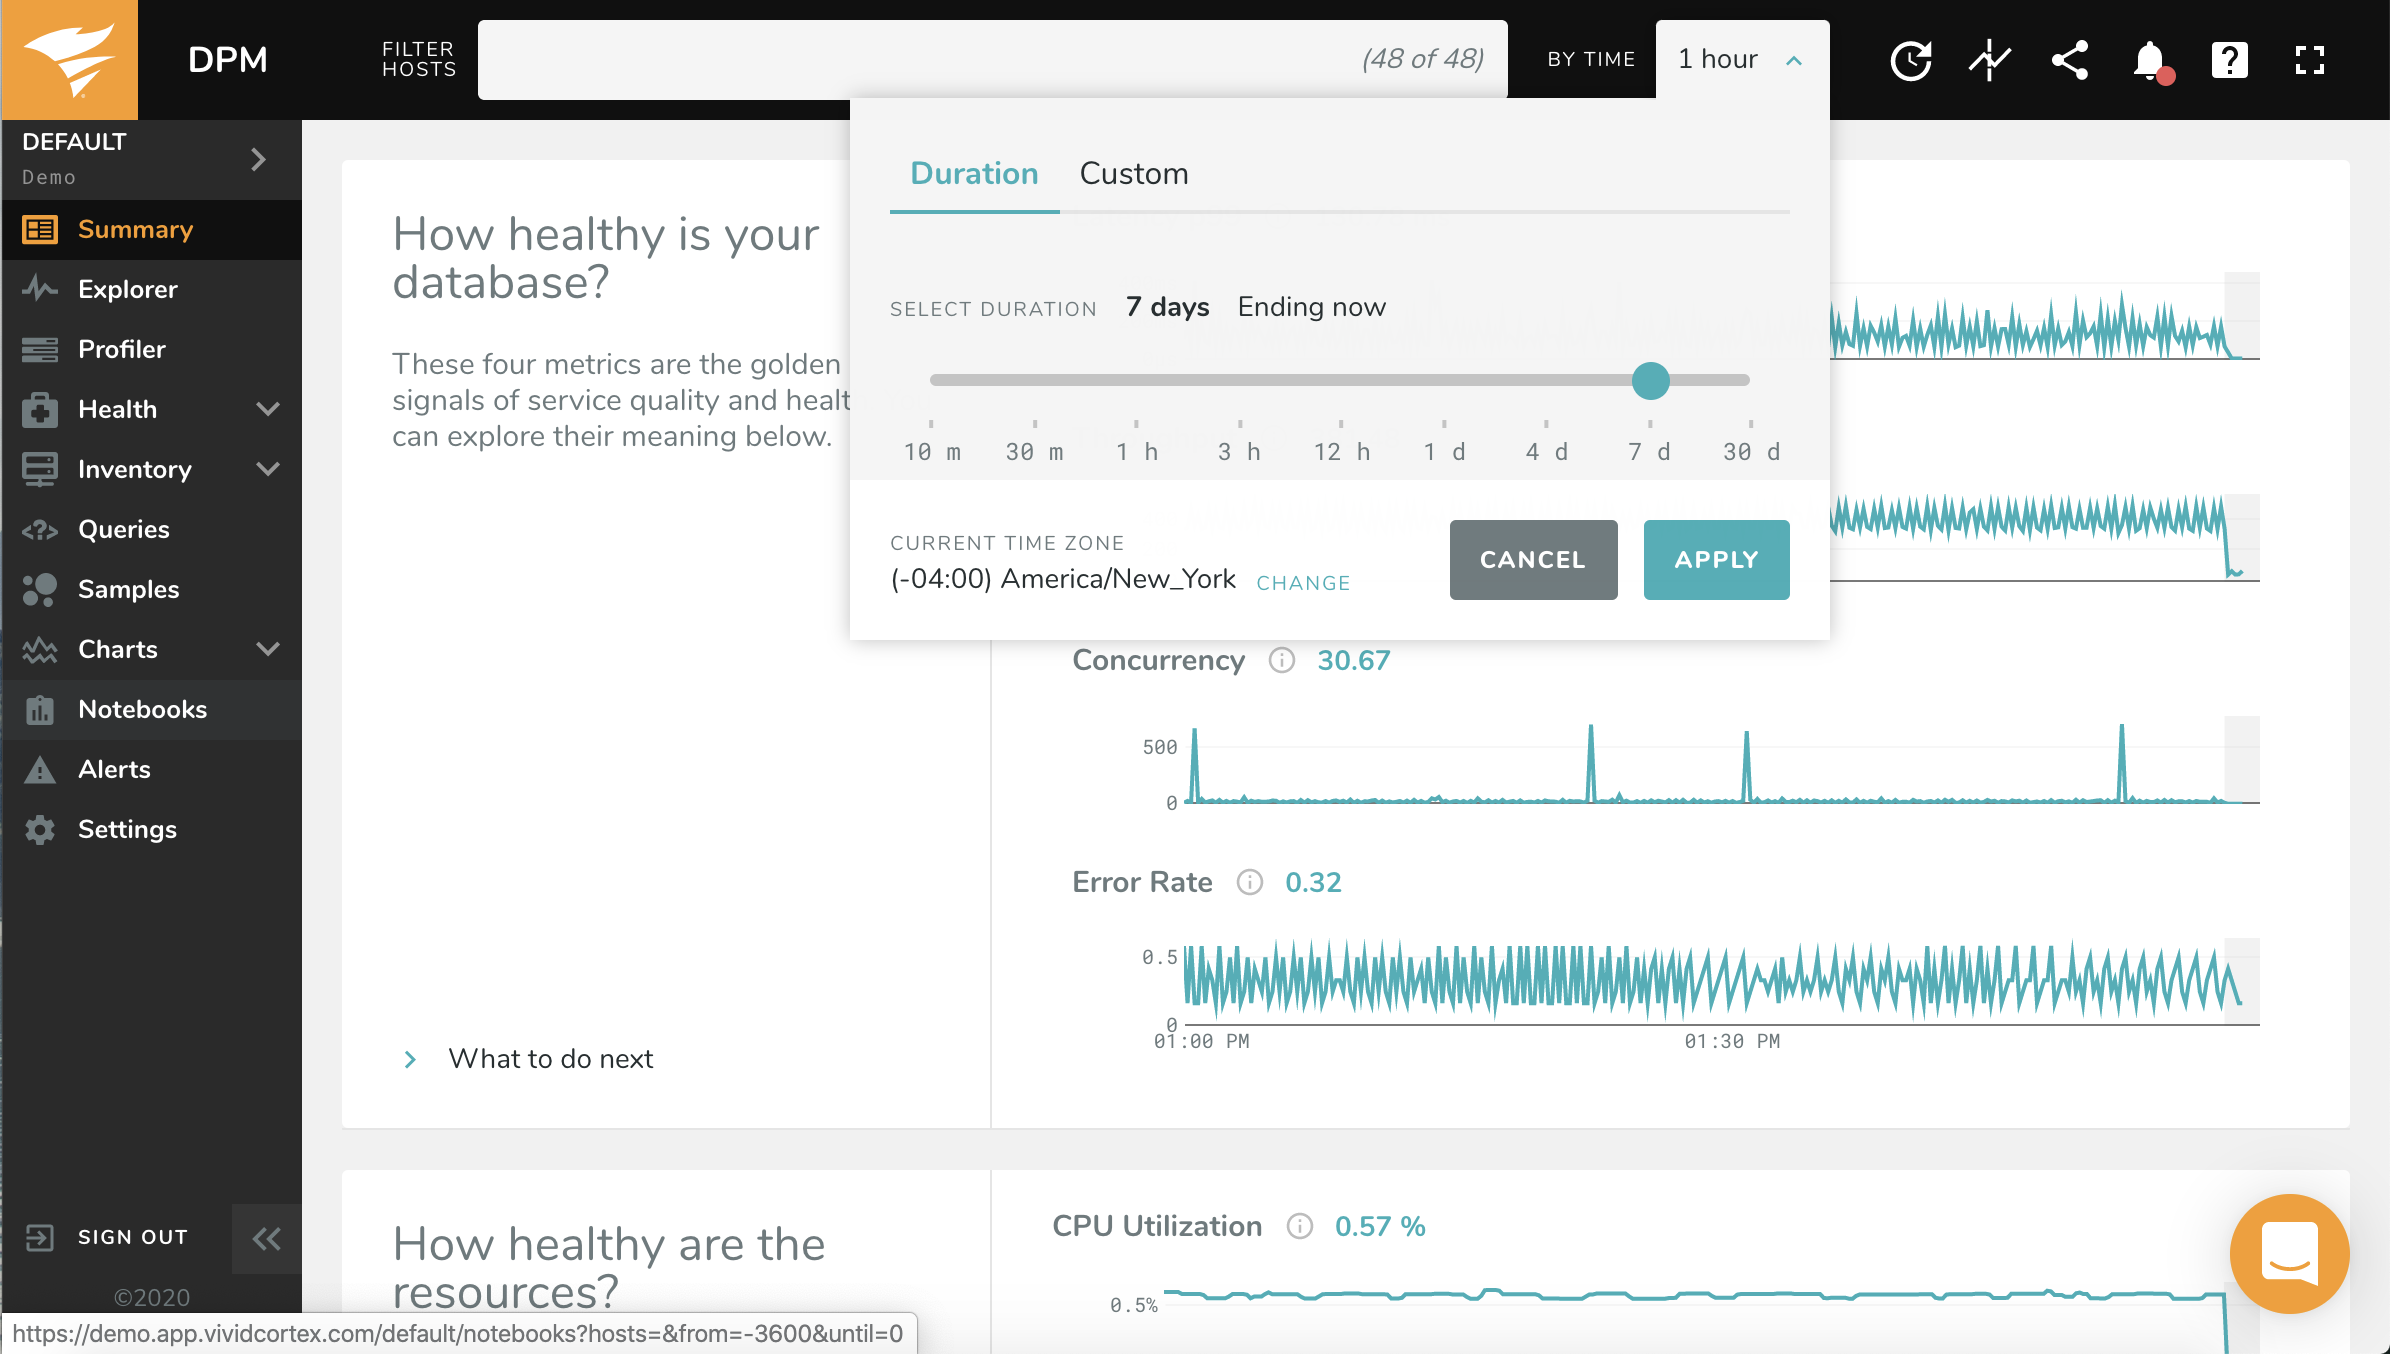
1. Select time range
Set the Time Picker to “Past 7 Days” and “Ending Now.” This will show you all results collected by DPM over the past week.
2. Profiler
Select the Profiler on the Navigation Bar on the left side of the screen.
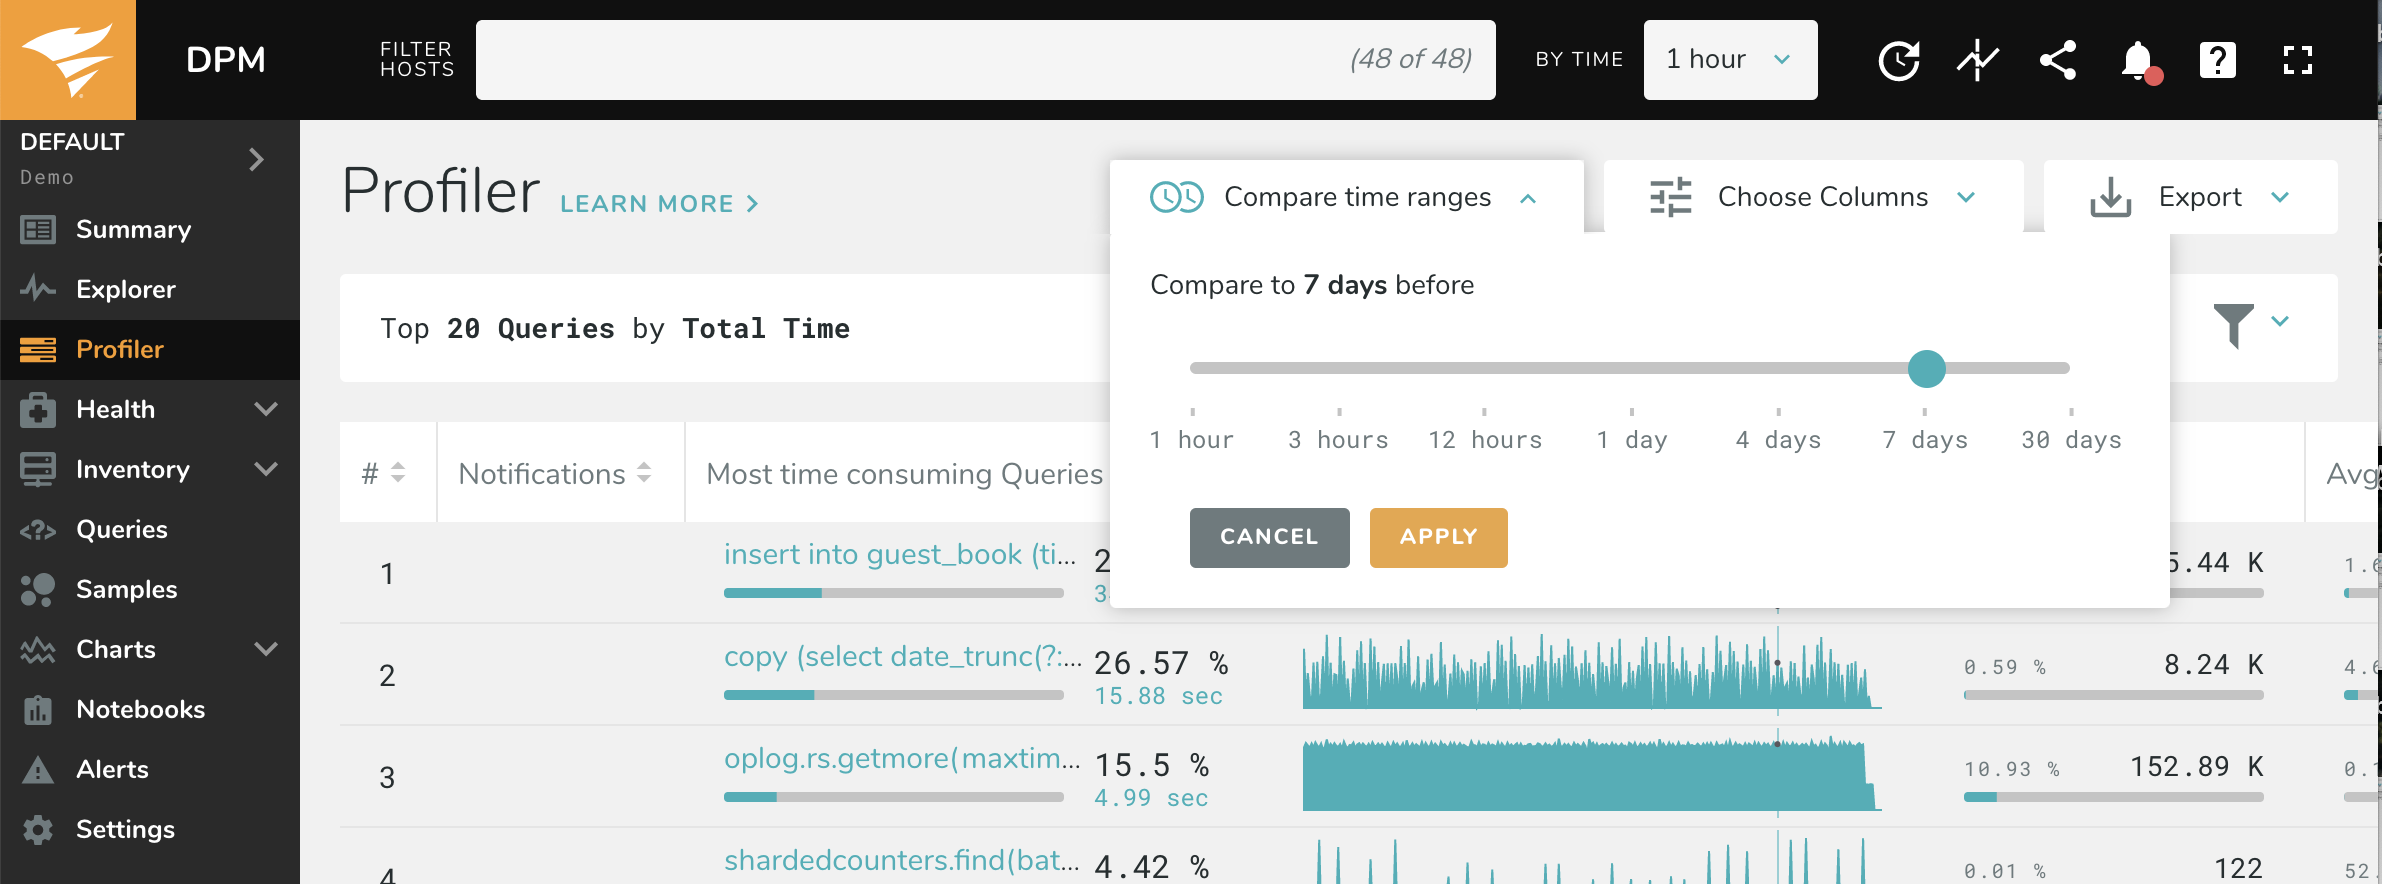
3. Turn on comparison
Toggle on the “Compare Time Ranges.” The default comparison window is 1 Hour. Click the drop down to select a new time frame of 7 Days. This will now display the last 7 days of metrics, compared to the prior 7 days.
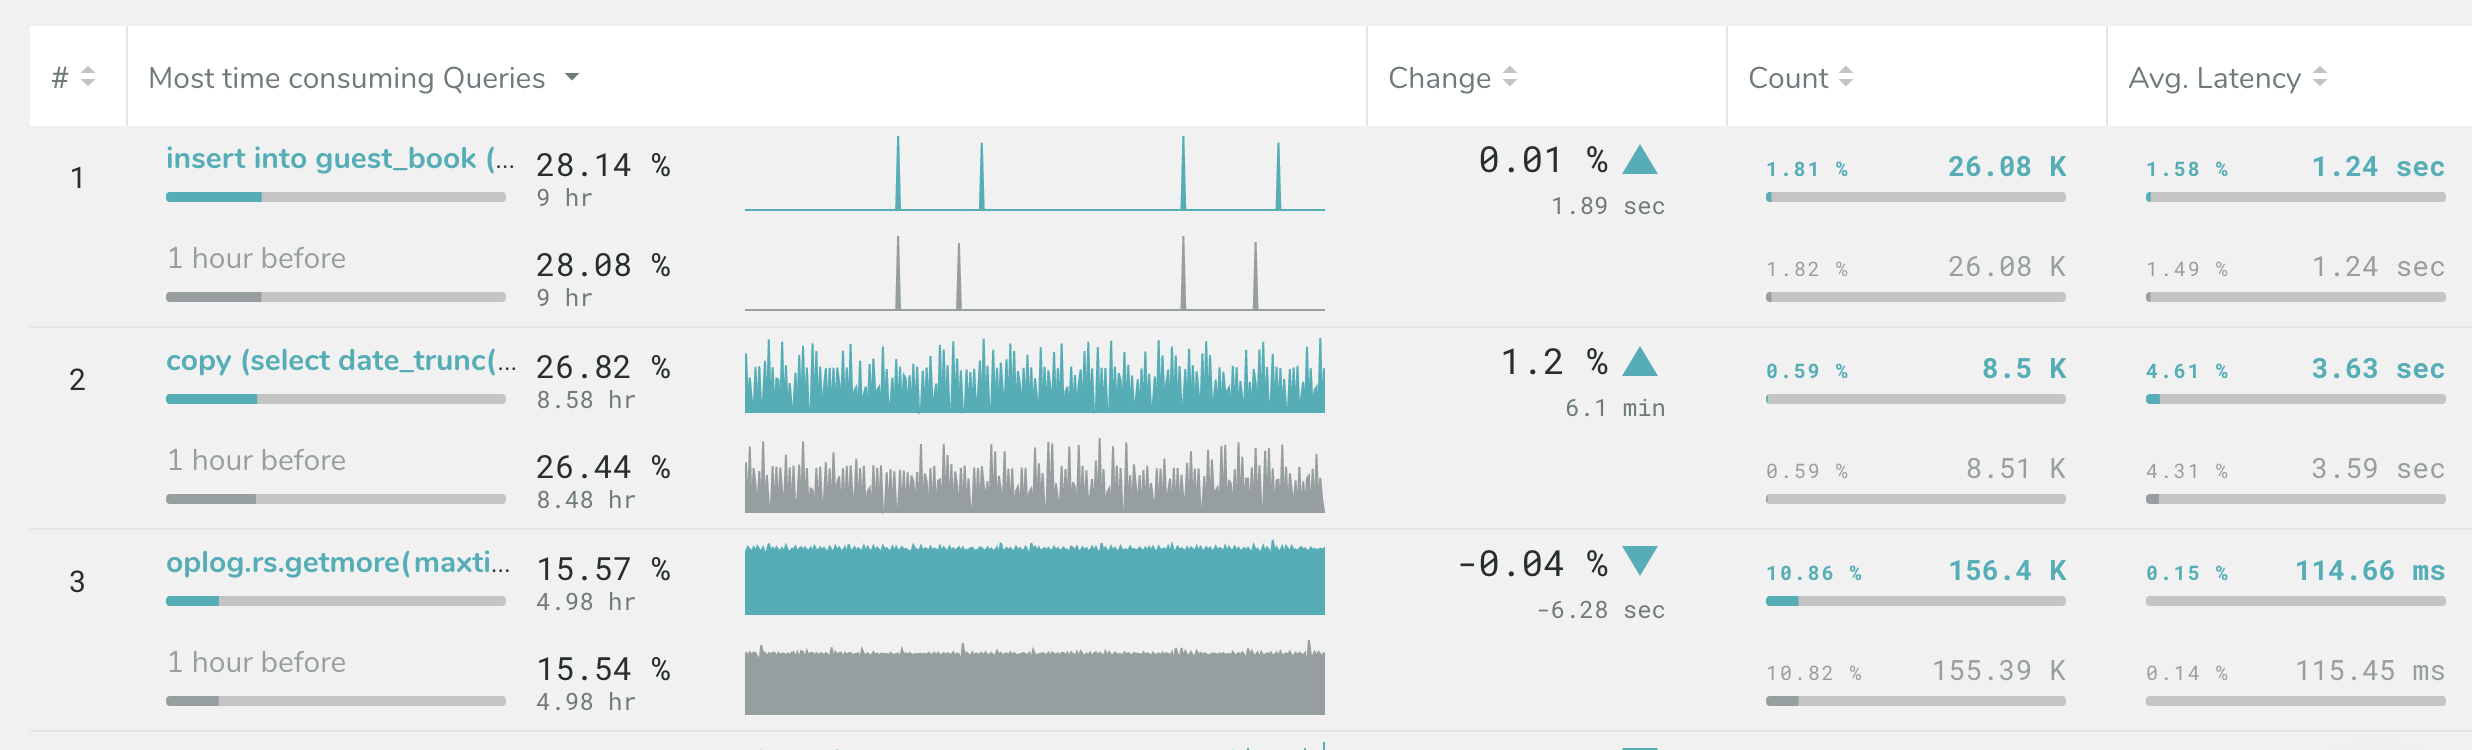
4. Compare system activity
The activity displayed shows a comparison between the past week and the week before. You can compare data for many categories, including queries, query verbs, users, and more. You can also measure against time, count, and many other options. Customize the ranking to fit your need.
Troubleshoot and Diagnose Outages
Dig into system health, as well as database and query performance, to isolate unusual behavior and potential contributing factors within the database. See behavior before and after an event, correleate query behaior to system metrics, and create and share post mortem documentation.
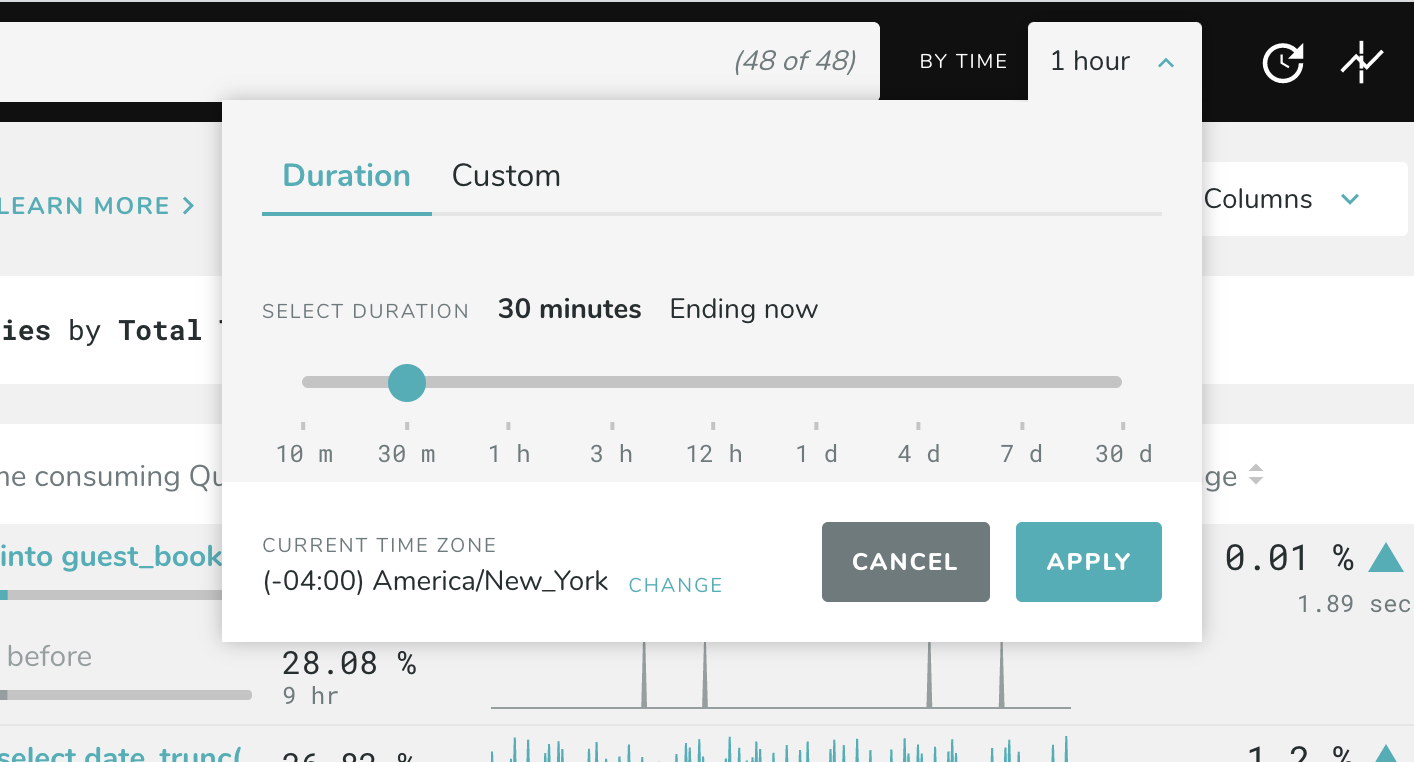
1. Select time range
Set the Time Picker to reflect a buffer of time before, during, and after the outage occurred. You can use a custom range, or if you are not sure exactly when the outage occurred, 30 Minutes or 1 Day are good default time periods.
2. Explorer
Select the Explorer on the Navigation Bar on the left side of the screen.
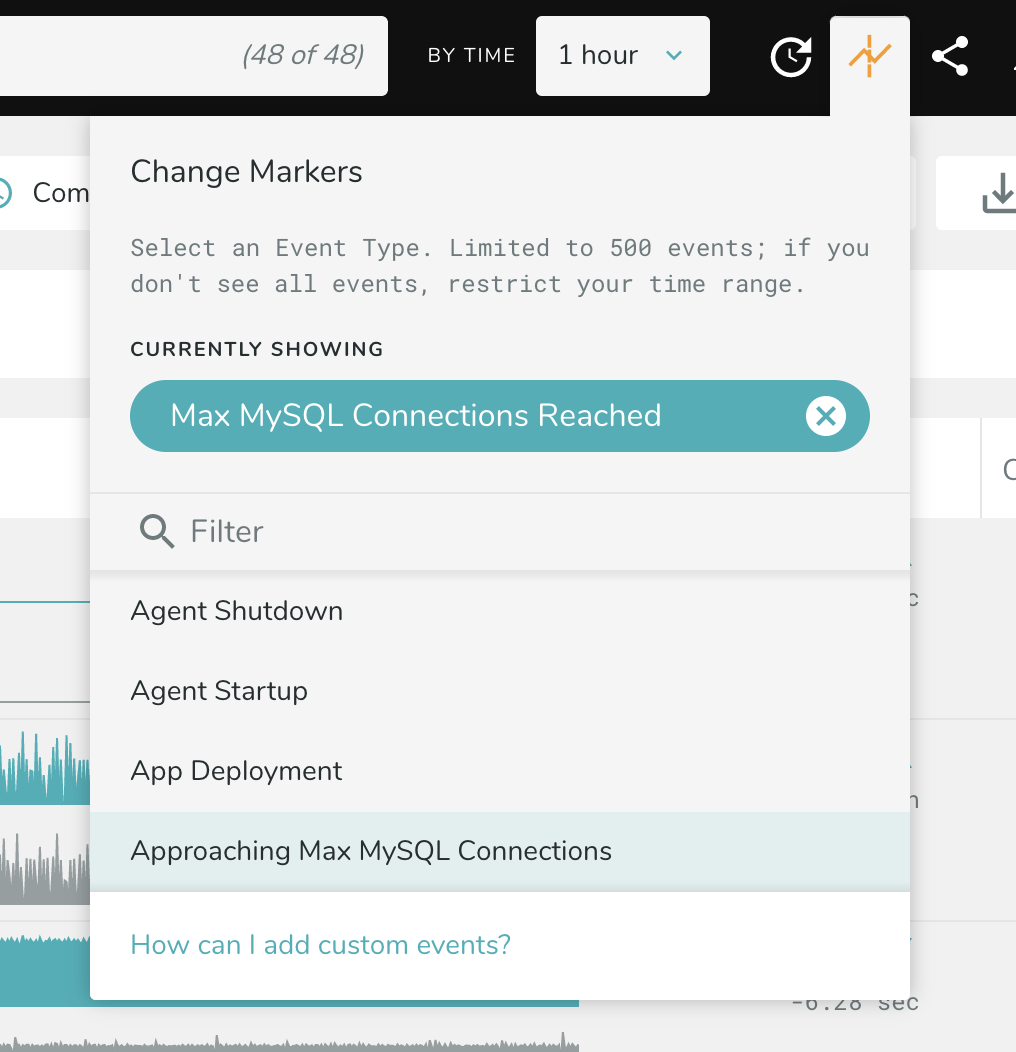
3. Turn on Change Markers
Select the menu for Change Markers. Select one option from the menu of Events you can choose from. Default Events are available selection, or you can add your own Custom Events.
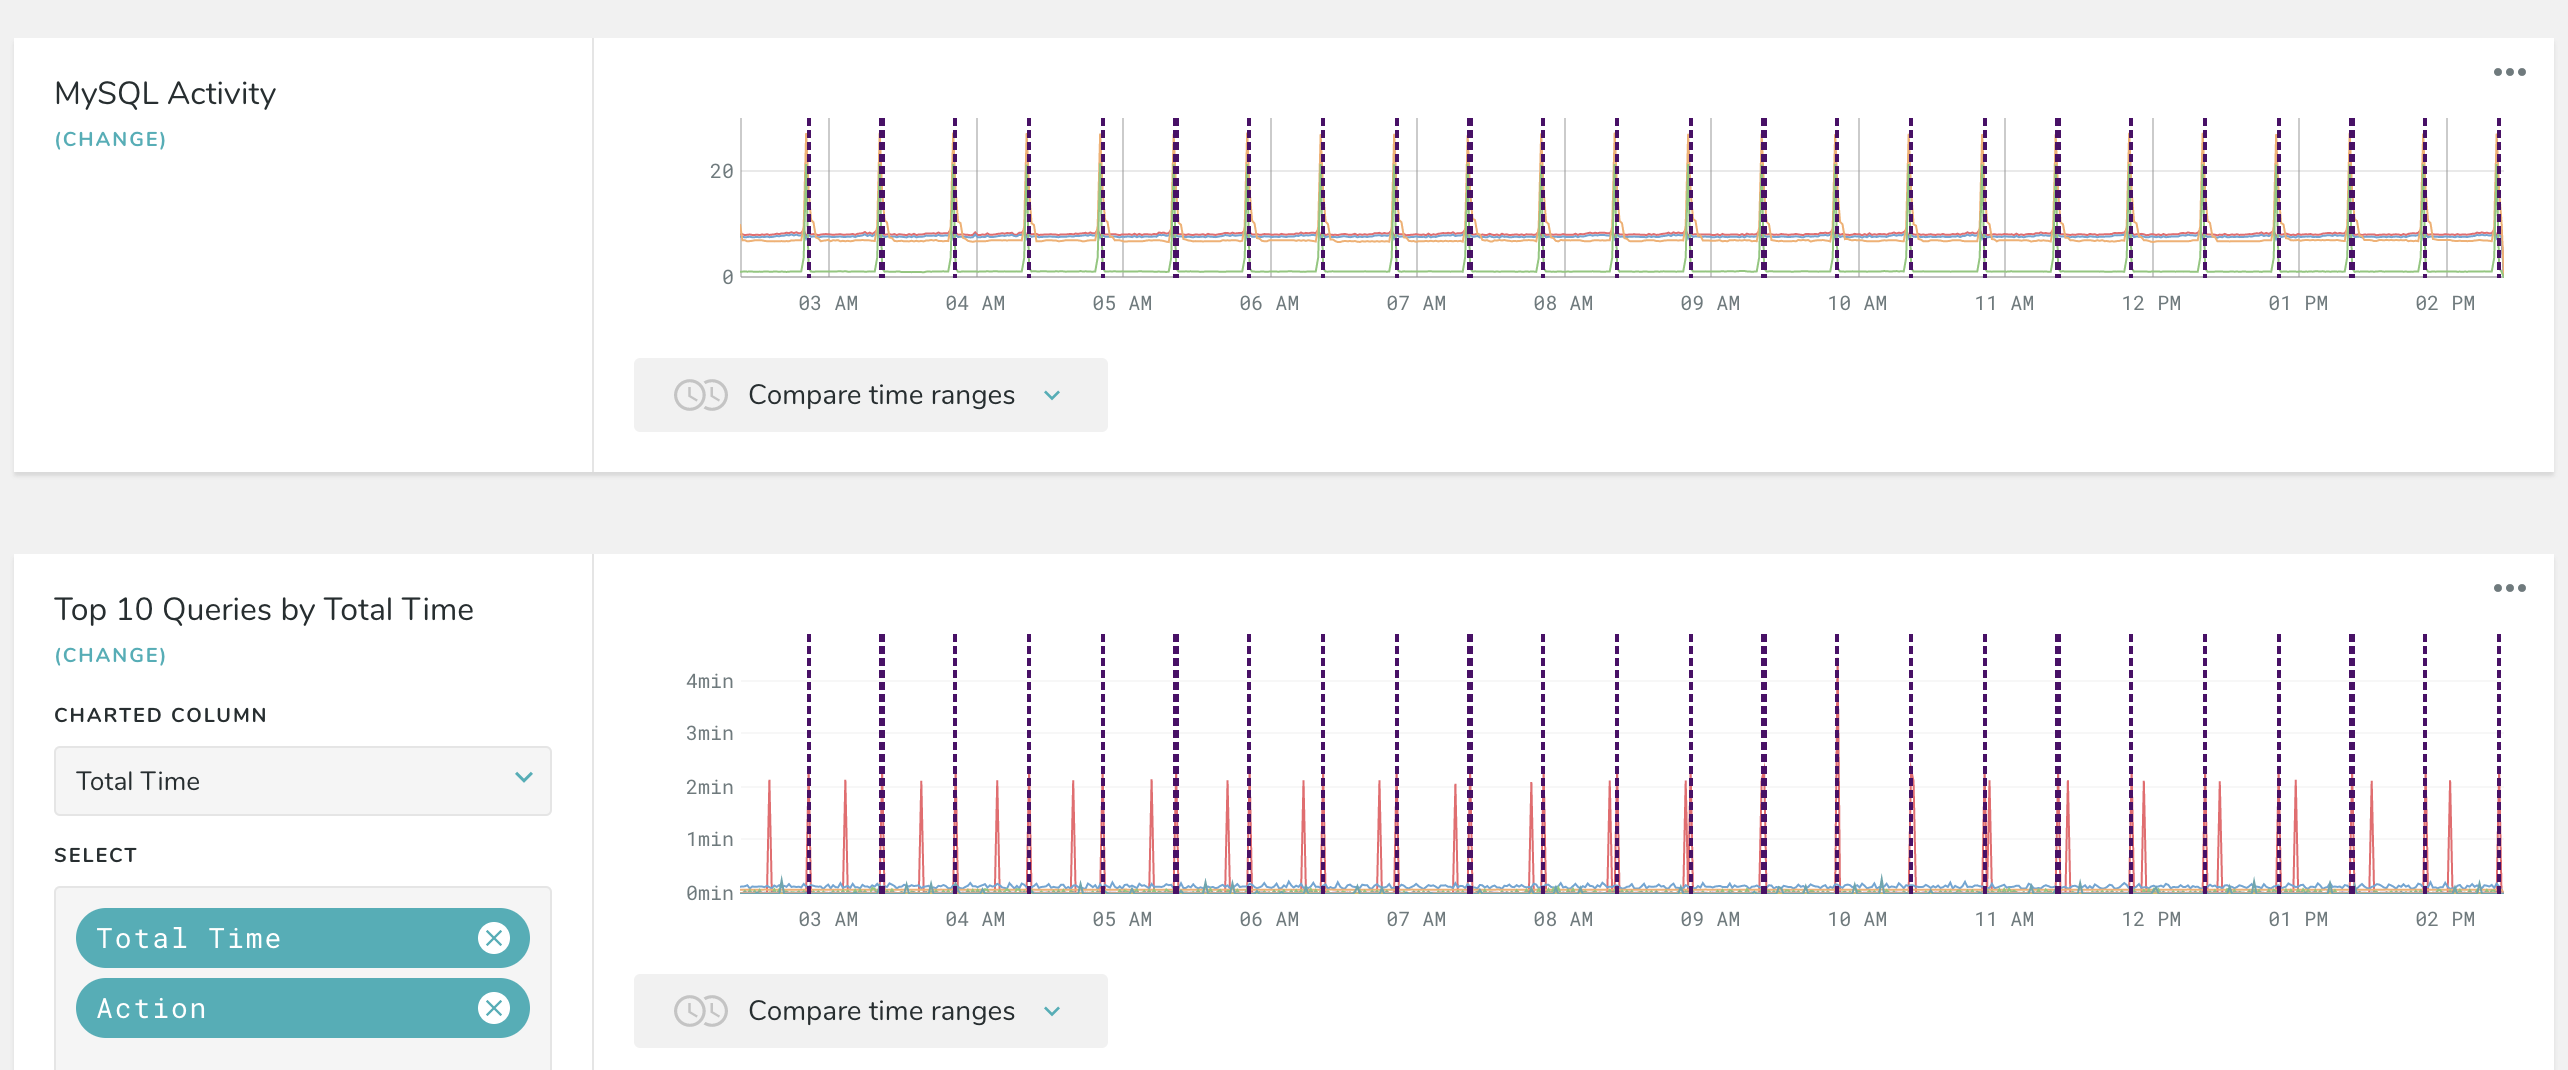
4. Compare system activity
There is now a Change Marker overlaid on the chart which allows you to easily see the behavior of system metrics or ranked queries around that Event.
Understand Database Health
Manage the day-to-day monitoring of your databases with easy and customizable features that allow you to understand your database health and get recommendations. See an overall health summary, get recommendations on best practices, and create customized dashboards to monitor KPIs.
1. Best Practices
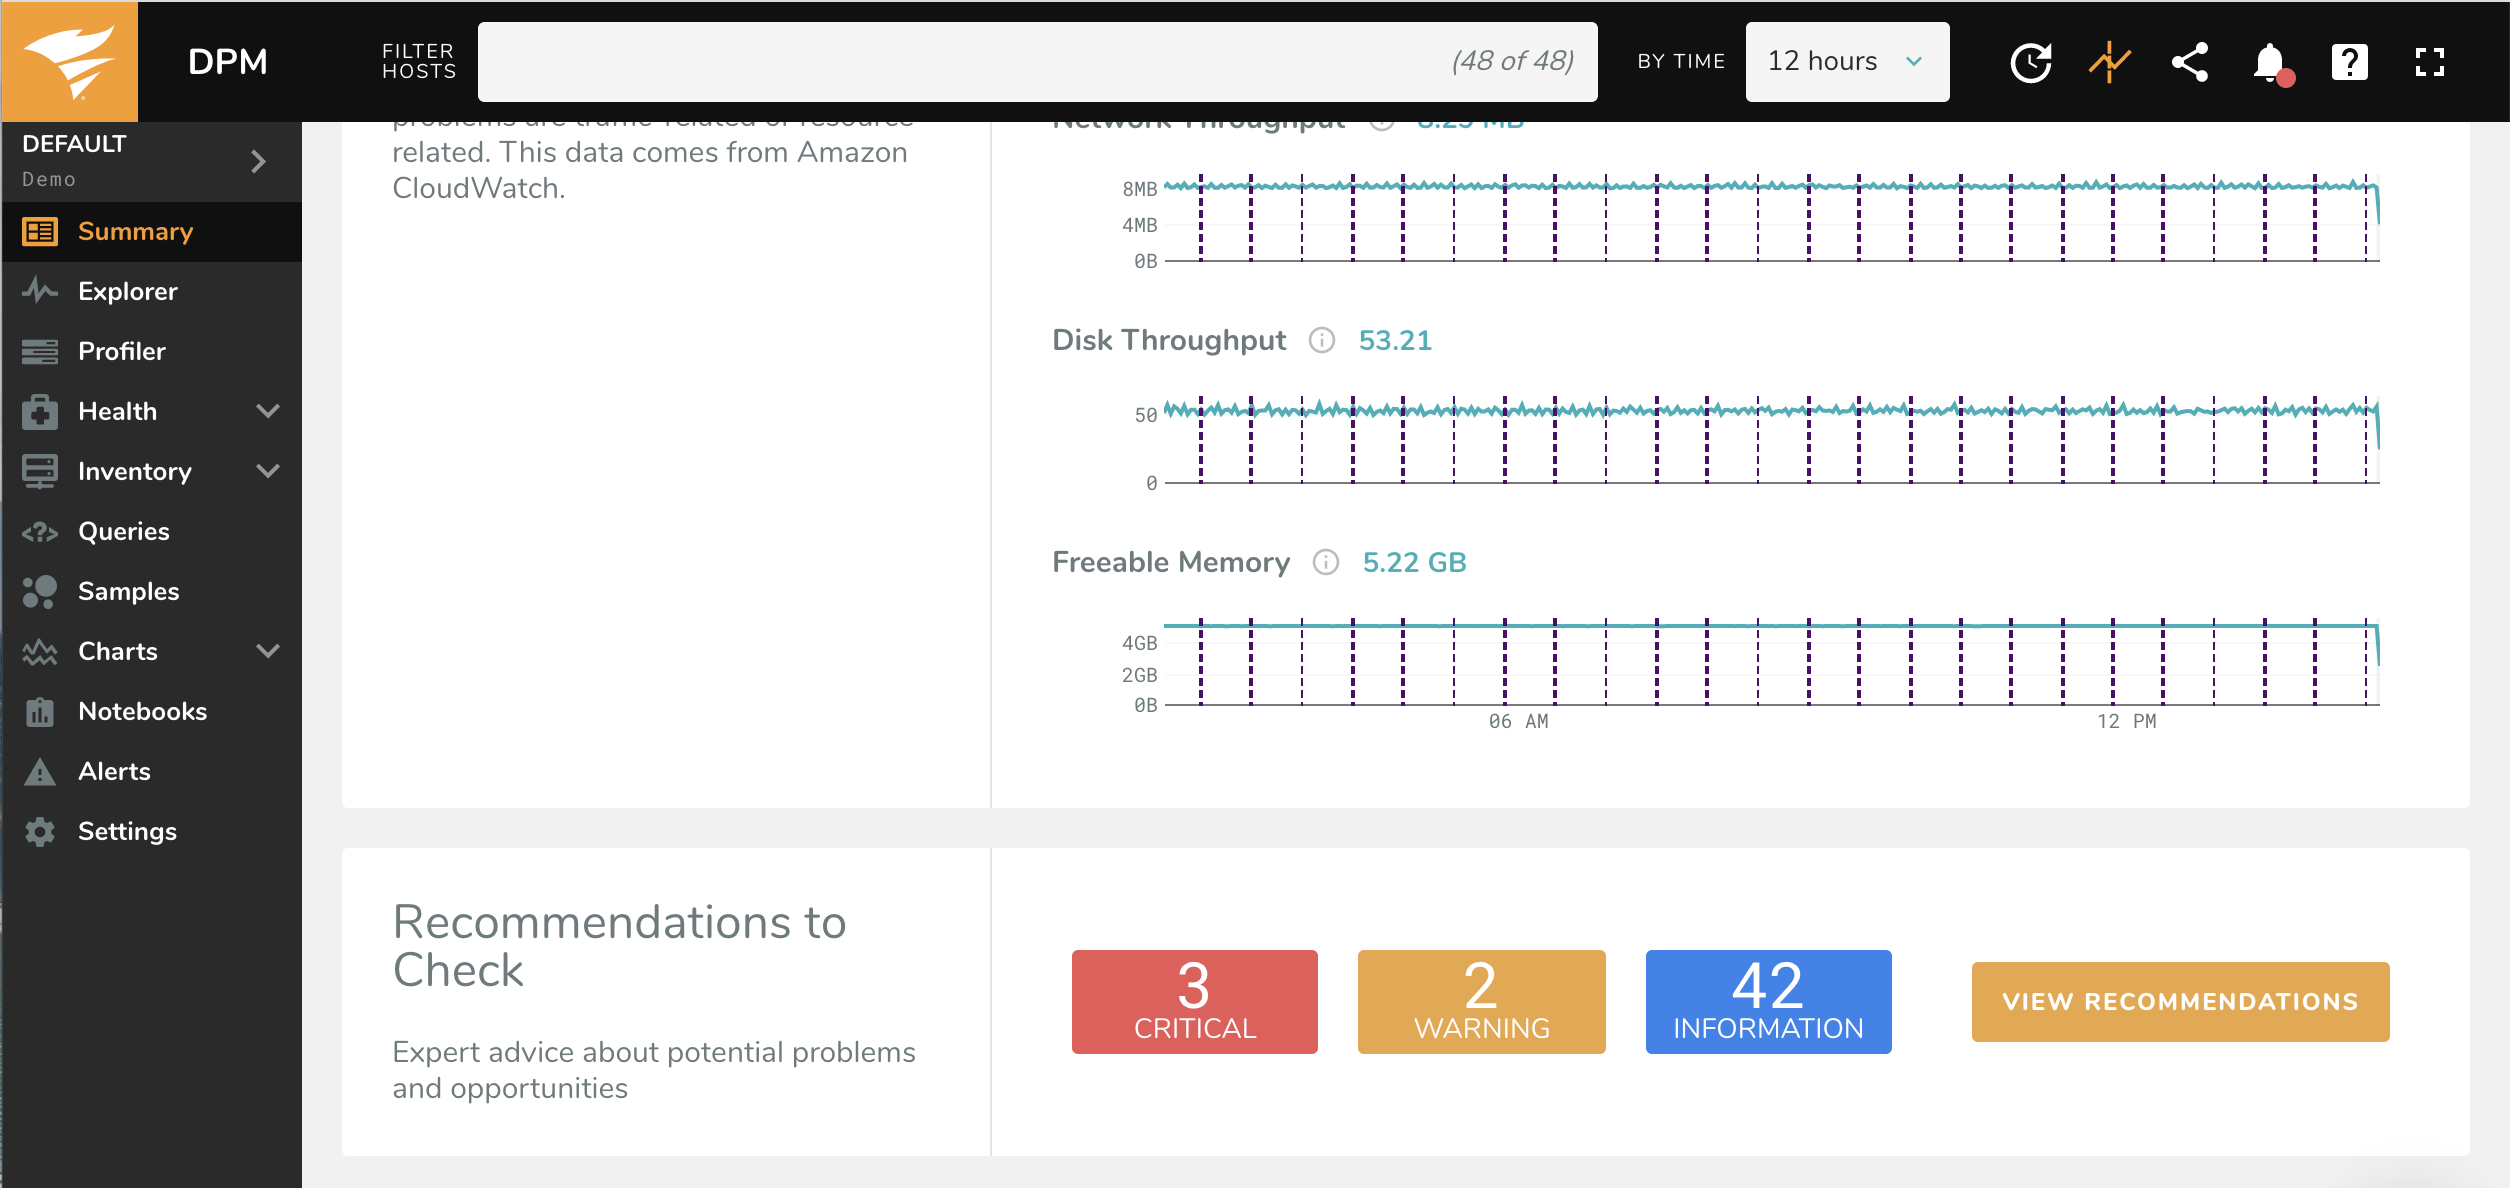
You can access the Best Practices page by clicking “View Recommendations” on the Summary page or by selecting Best Practices under Health on the Navigation Bar.
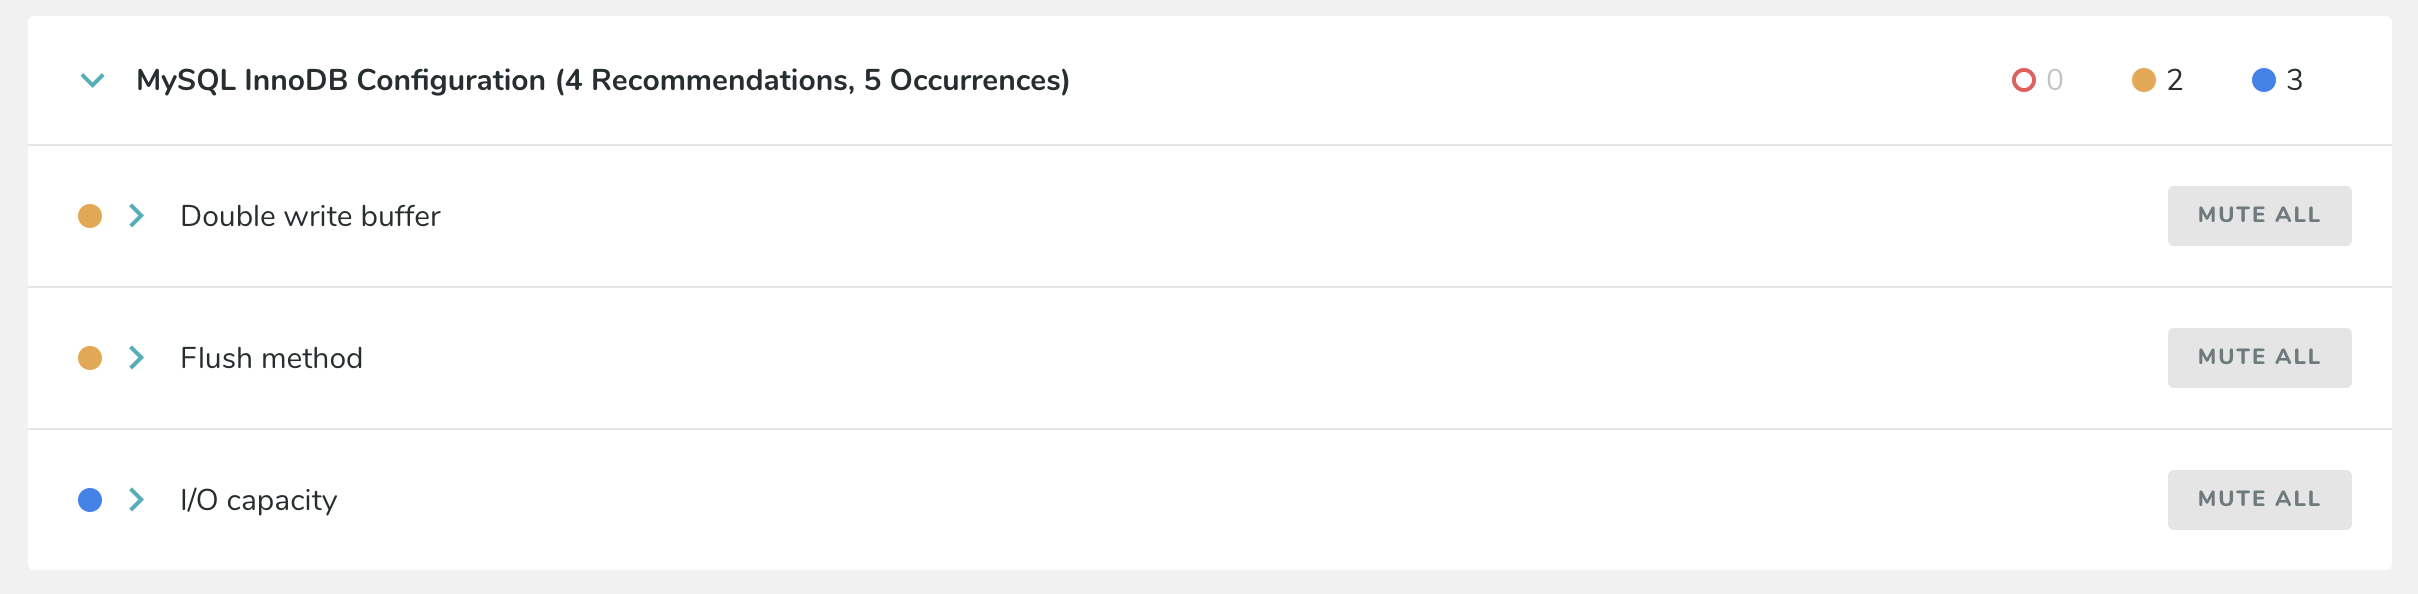
2. Review summary
At the top of the Best Practices page is a status summary of the checks your environment has gone through.
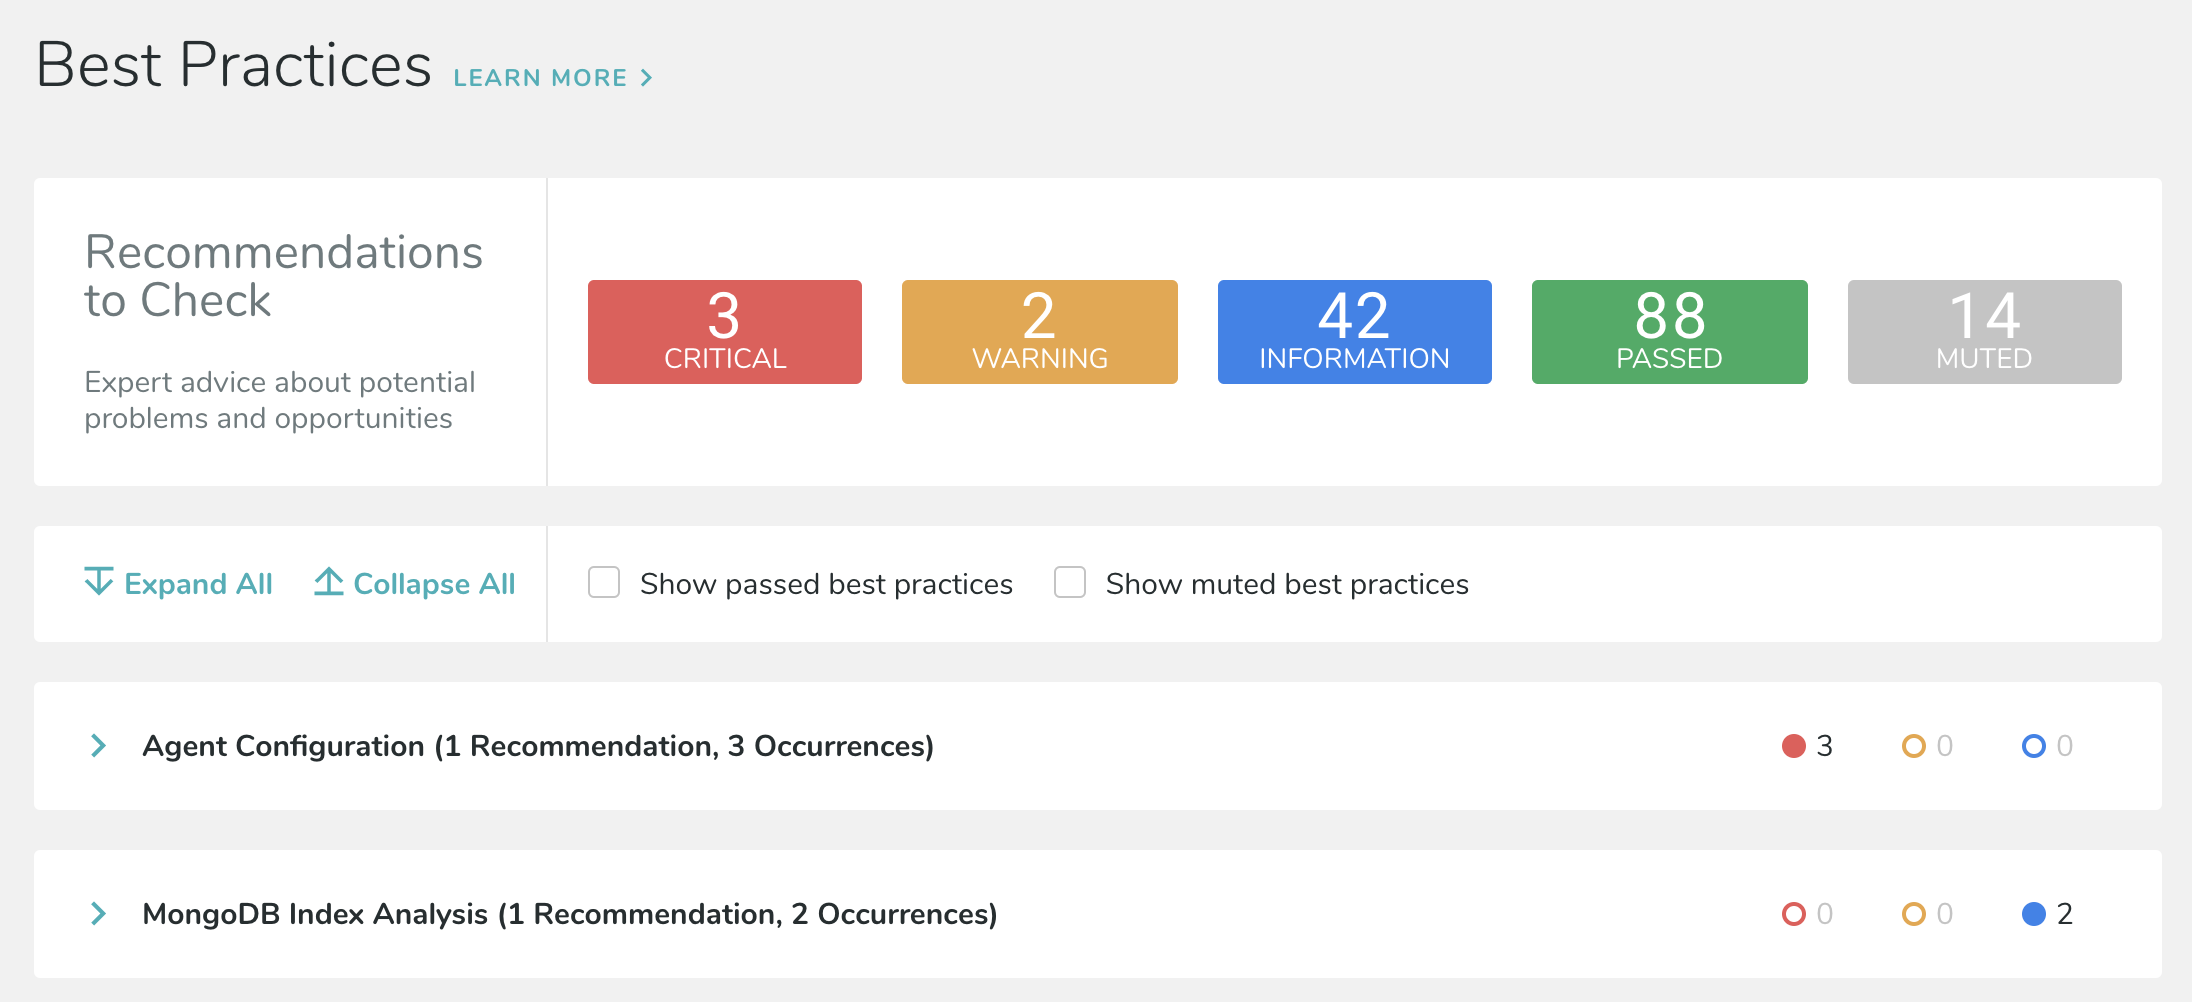
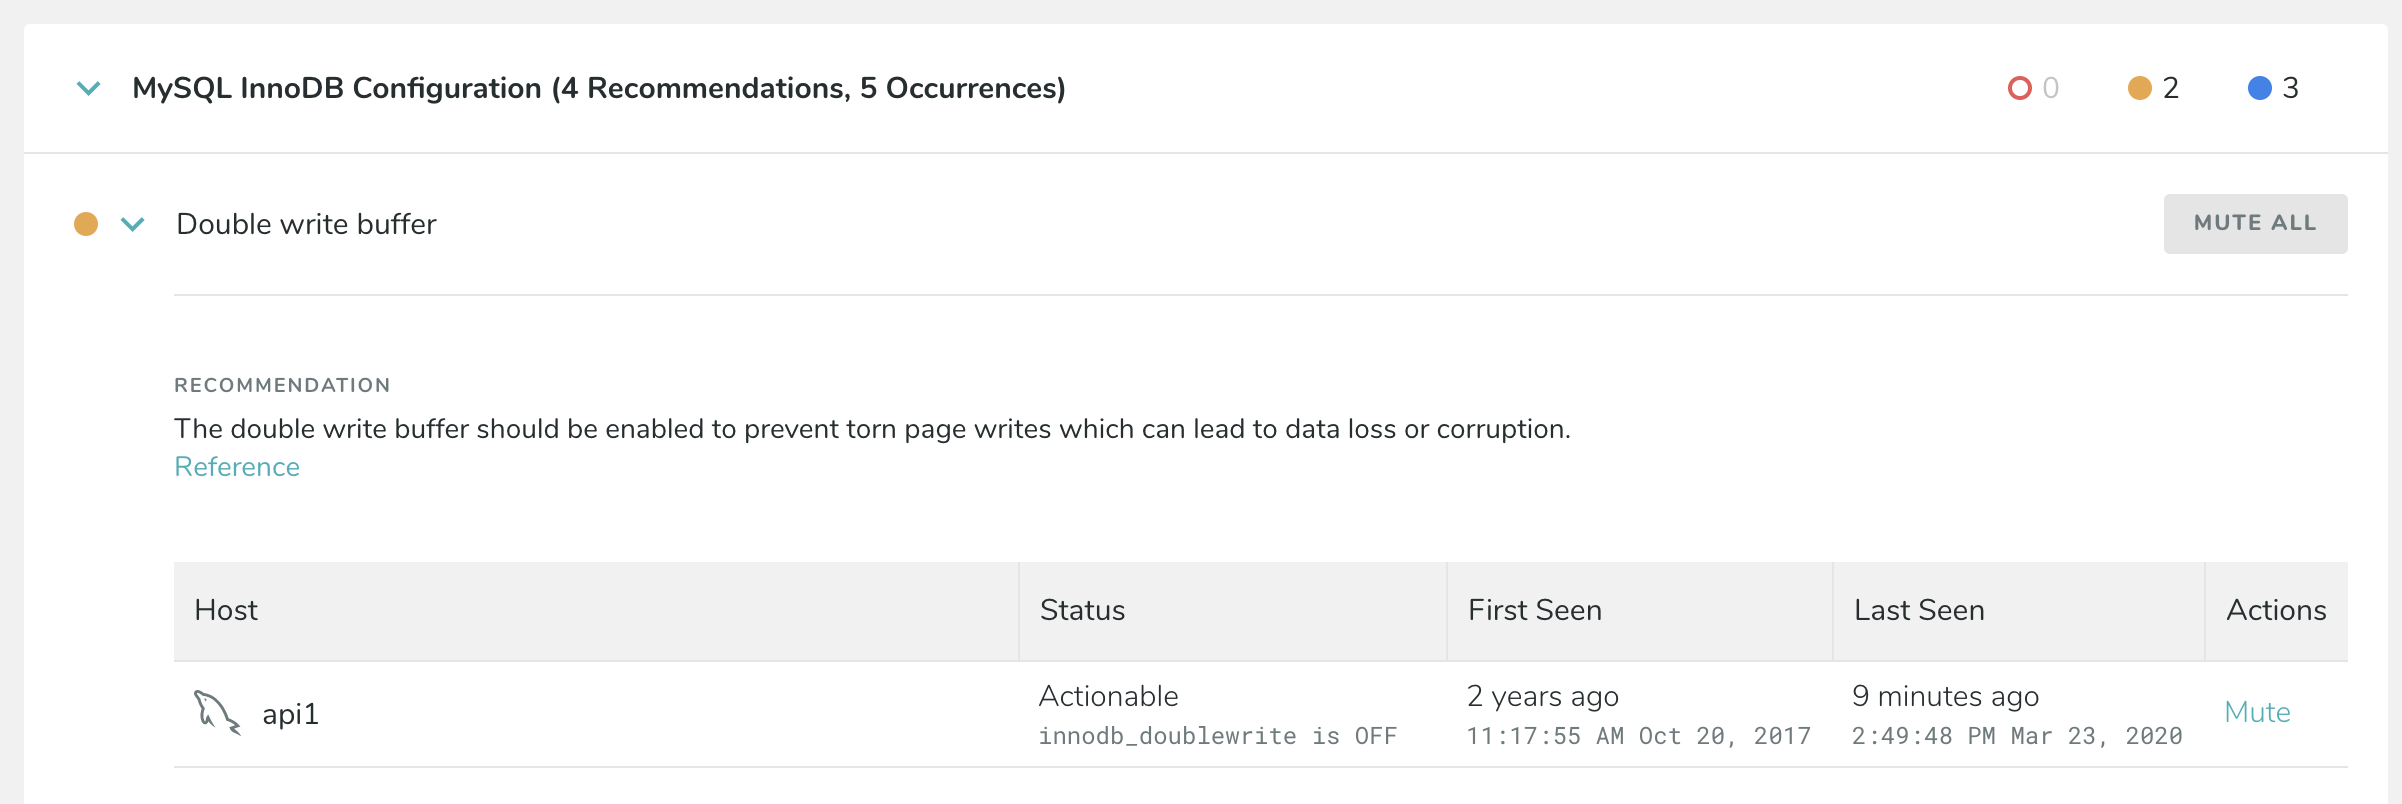
3. Explore recommendations
Expand a category to see the recommendations and the occurrences related to that recommendation.
Explore Database Anomalies
Get context around anomalies in your database by correlating system metrics to query behavior and then digging into details on queries, systems, and recommendations. Then, create alerts for future peace of mind. Compare system behavior to performance outliers and integrate alerts into incident resolution platforms.
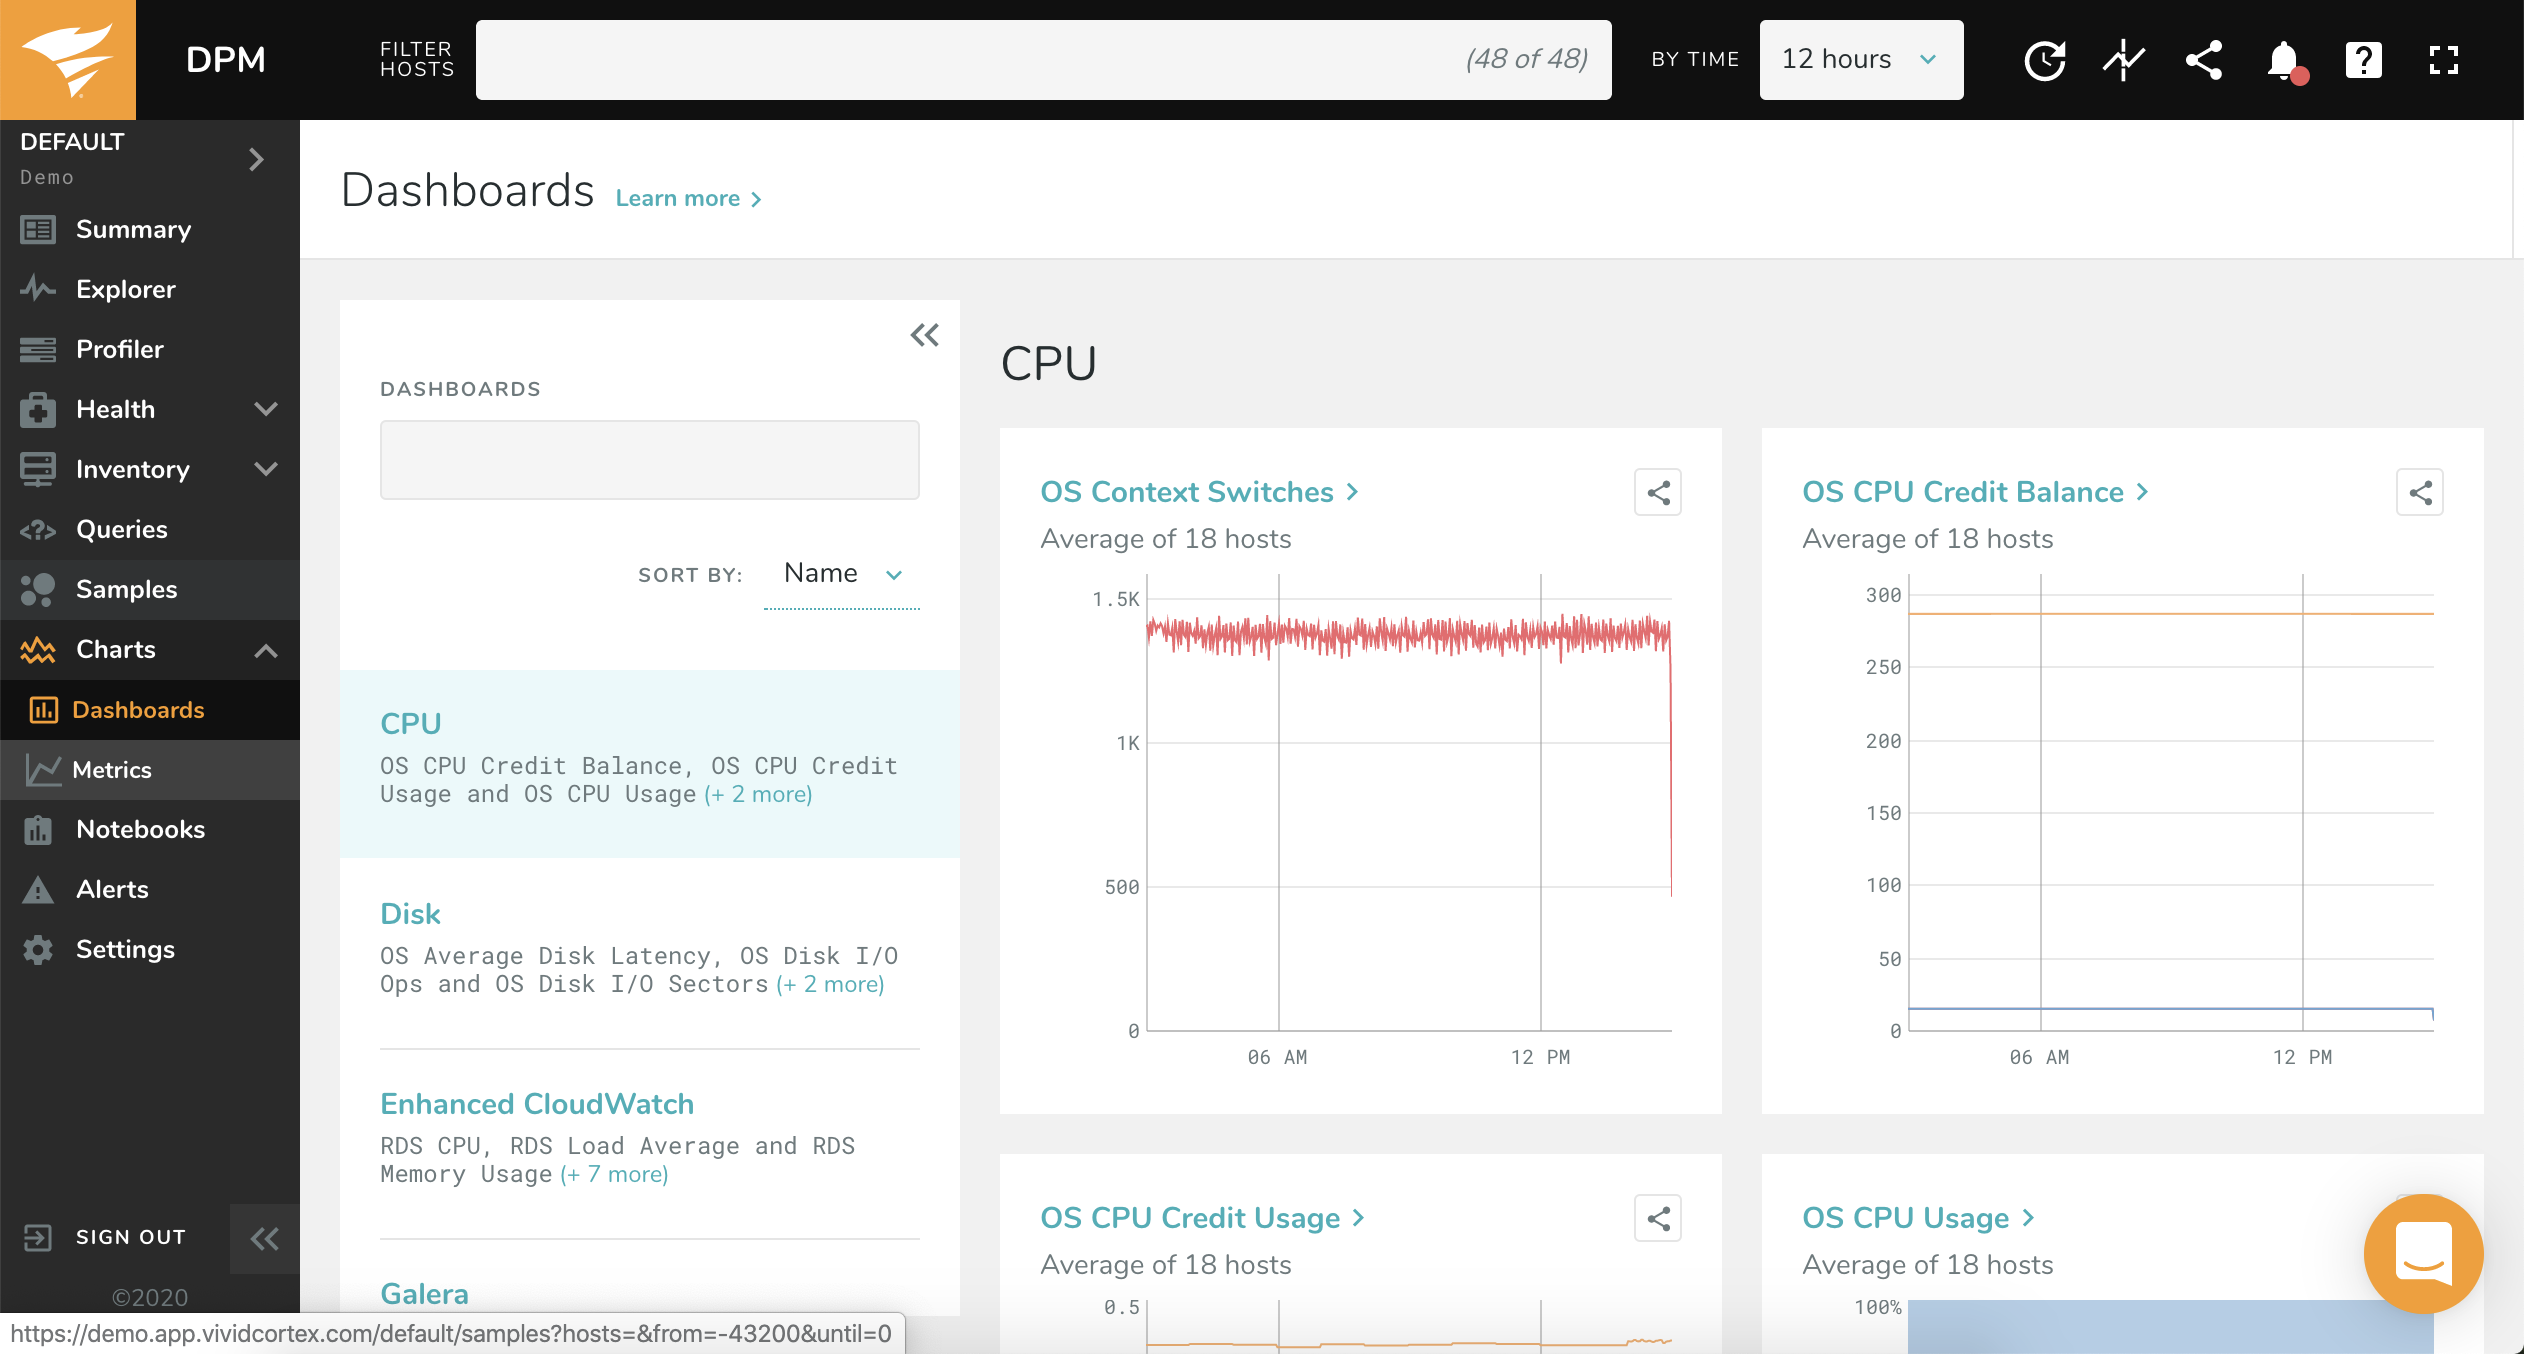
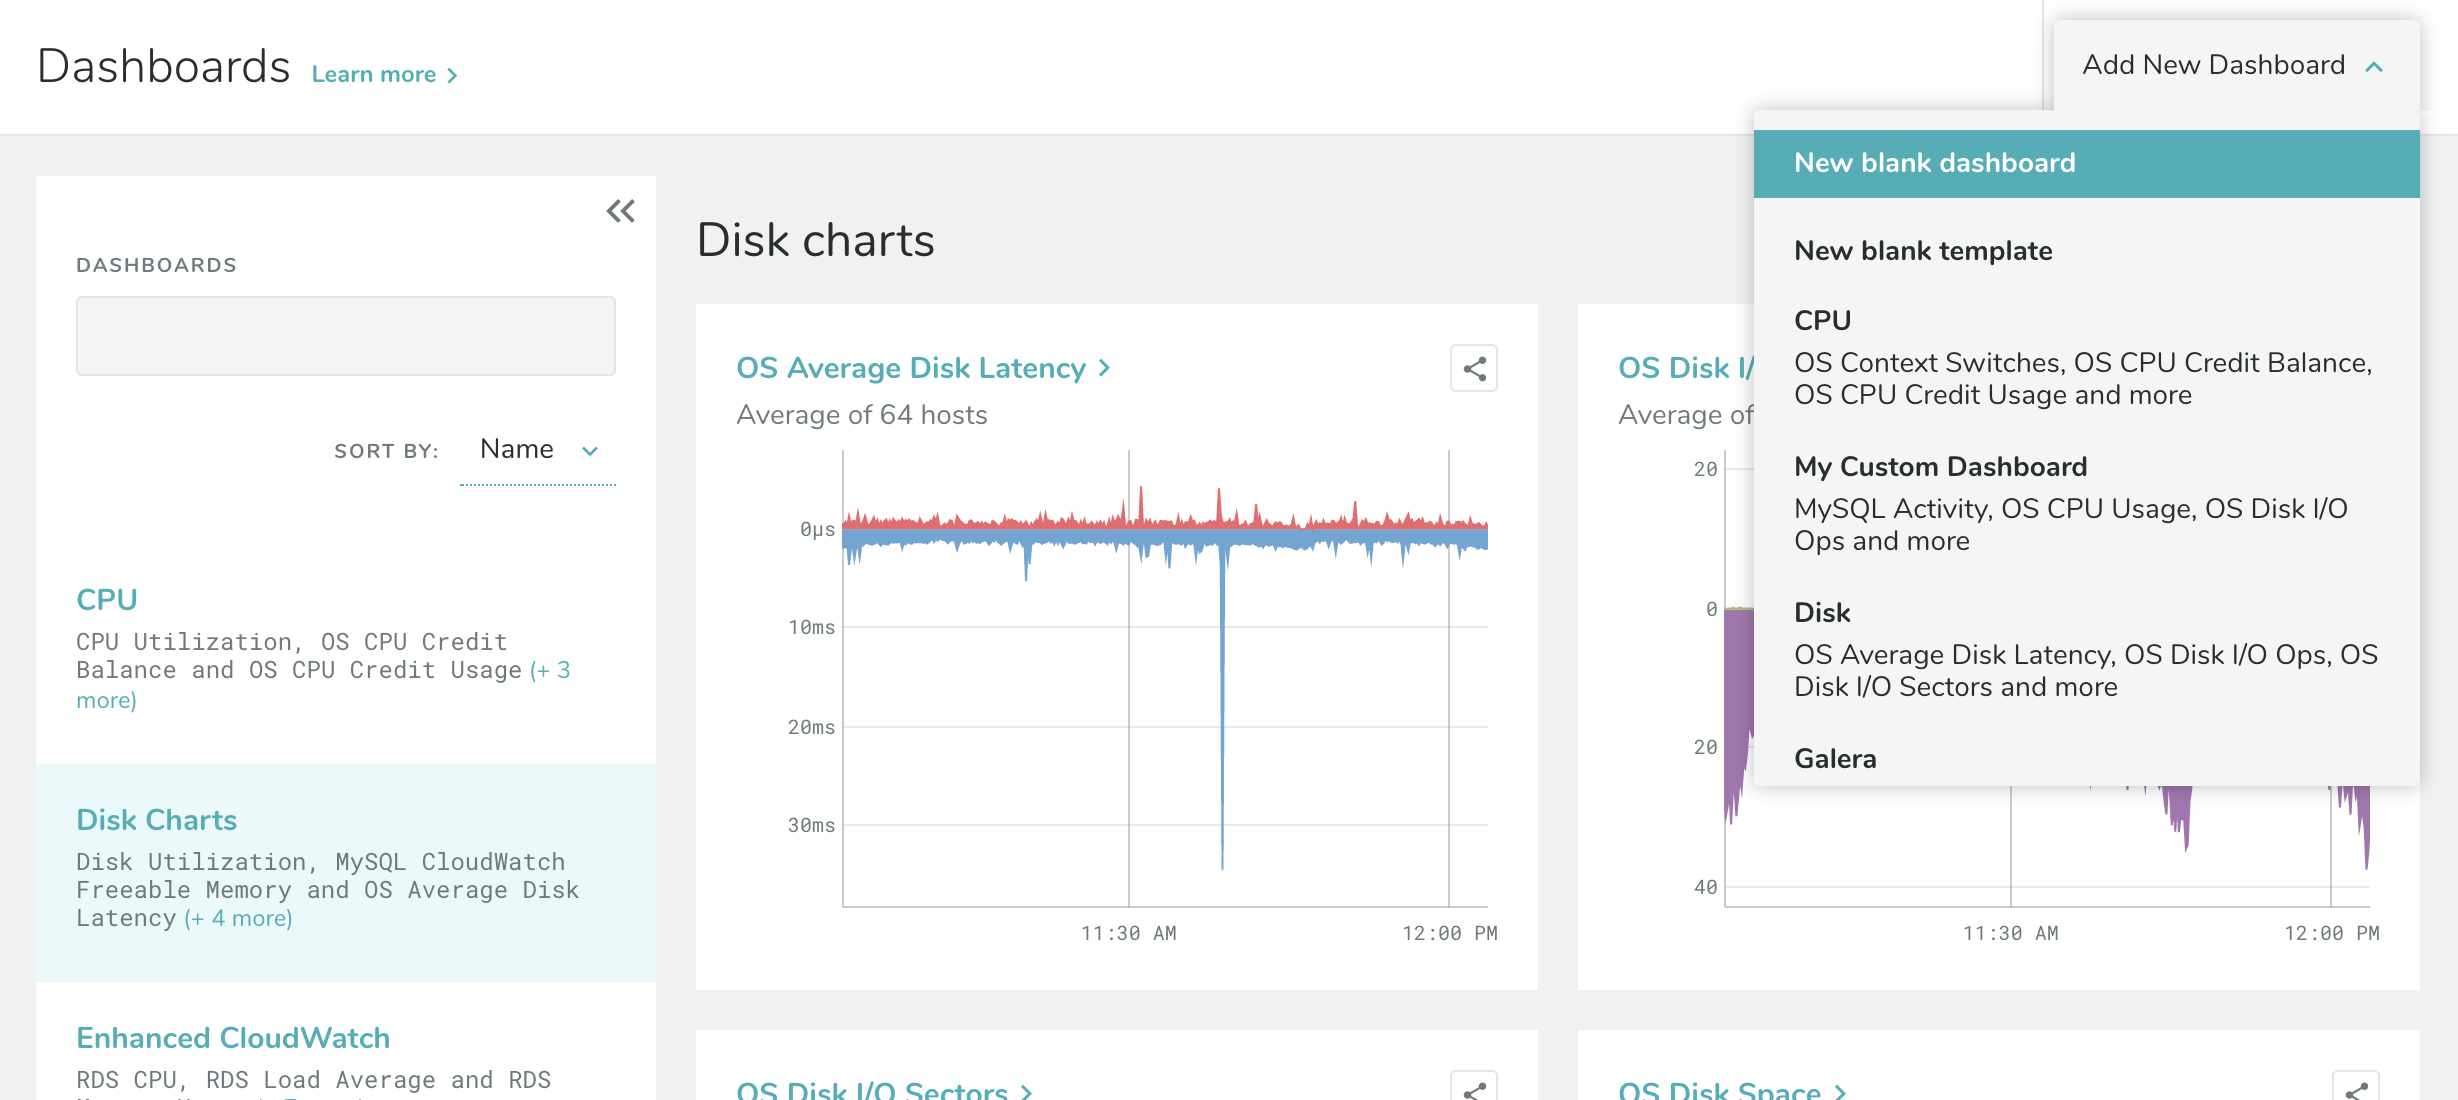
1. Charts Dashboards
From the Charts Dashboards page you can select from a series of dashboard templates based on database type and metrics category.
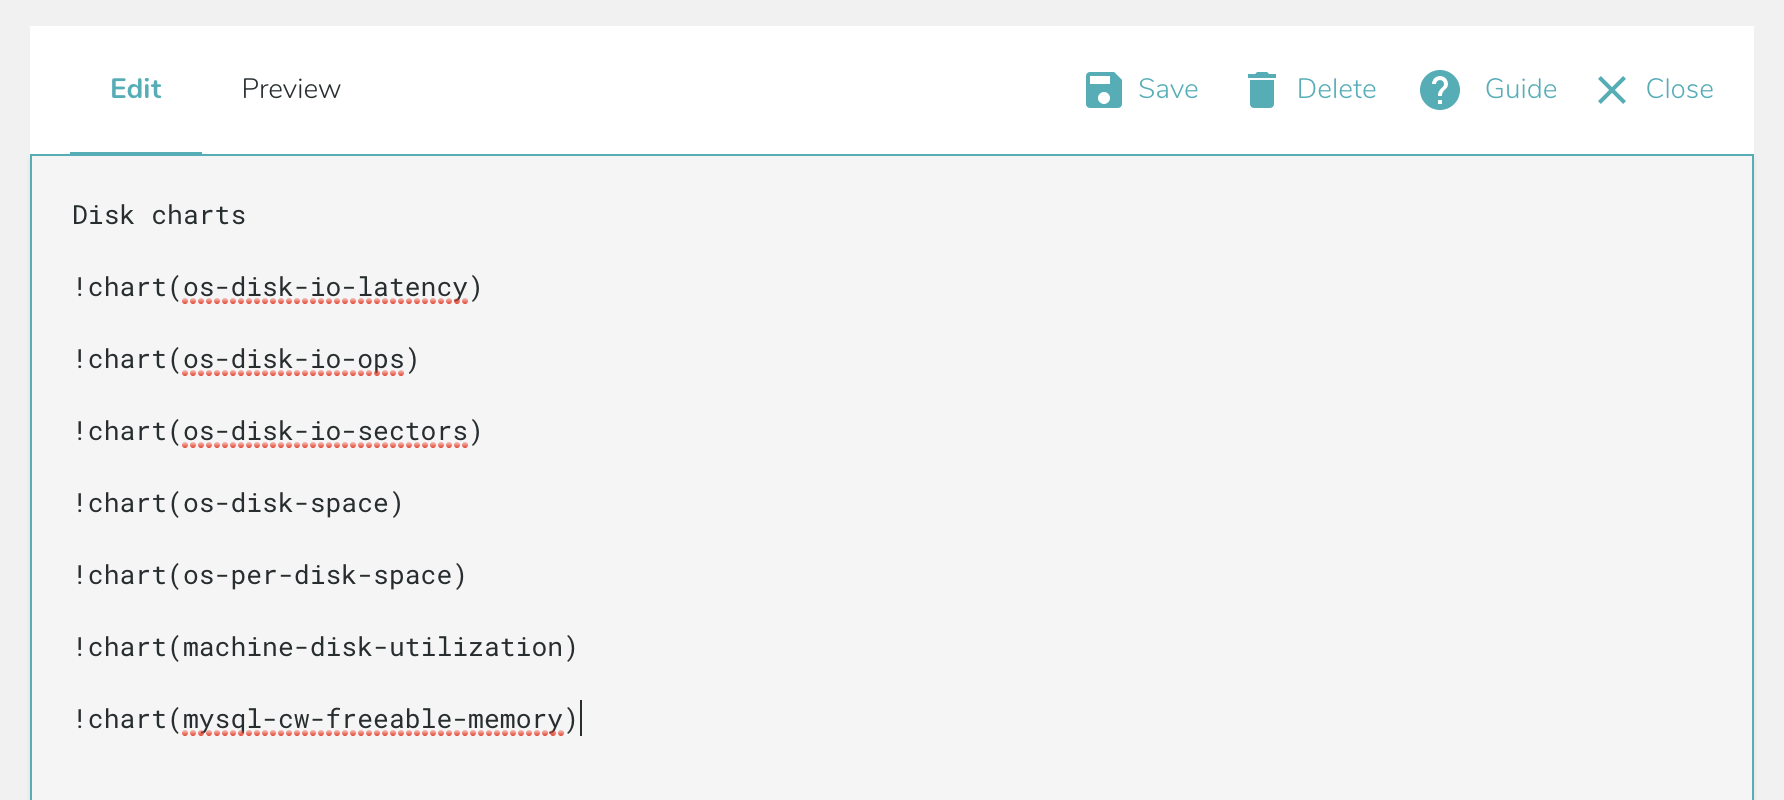
2. Editing a Dashboard
You can use markdown syntax to make changes to any dashboard.
3. Creating New Dashboards
You can also create new Dashboards. Select Add New Dashboard at the top of the page to create a customized selection of charts that you can save and revisit. You can start with a blank form or use a template from any of our default Dashboards.
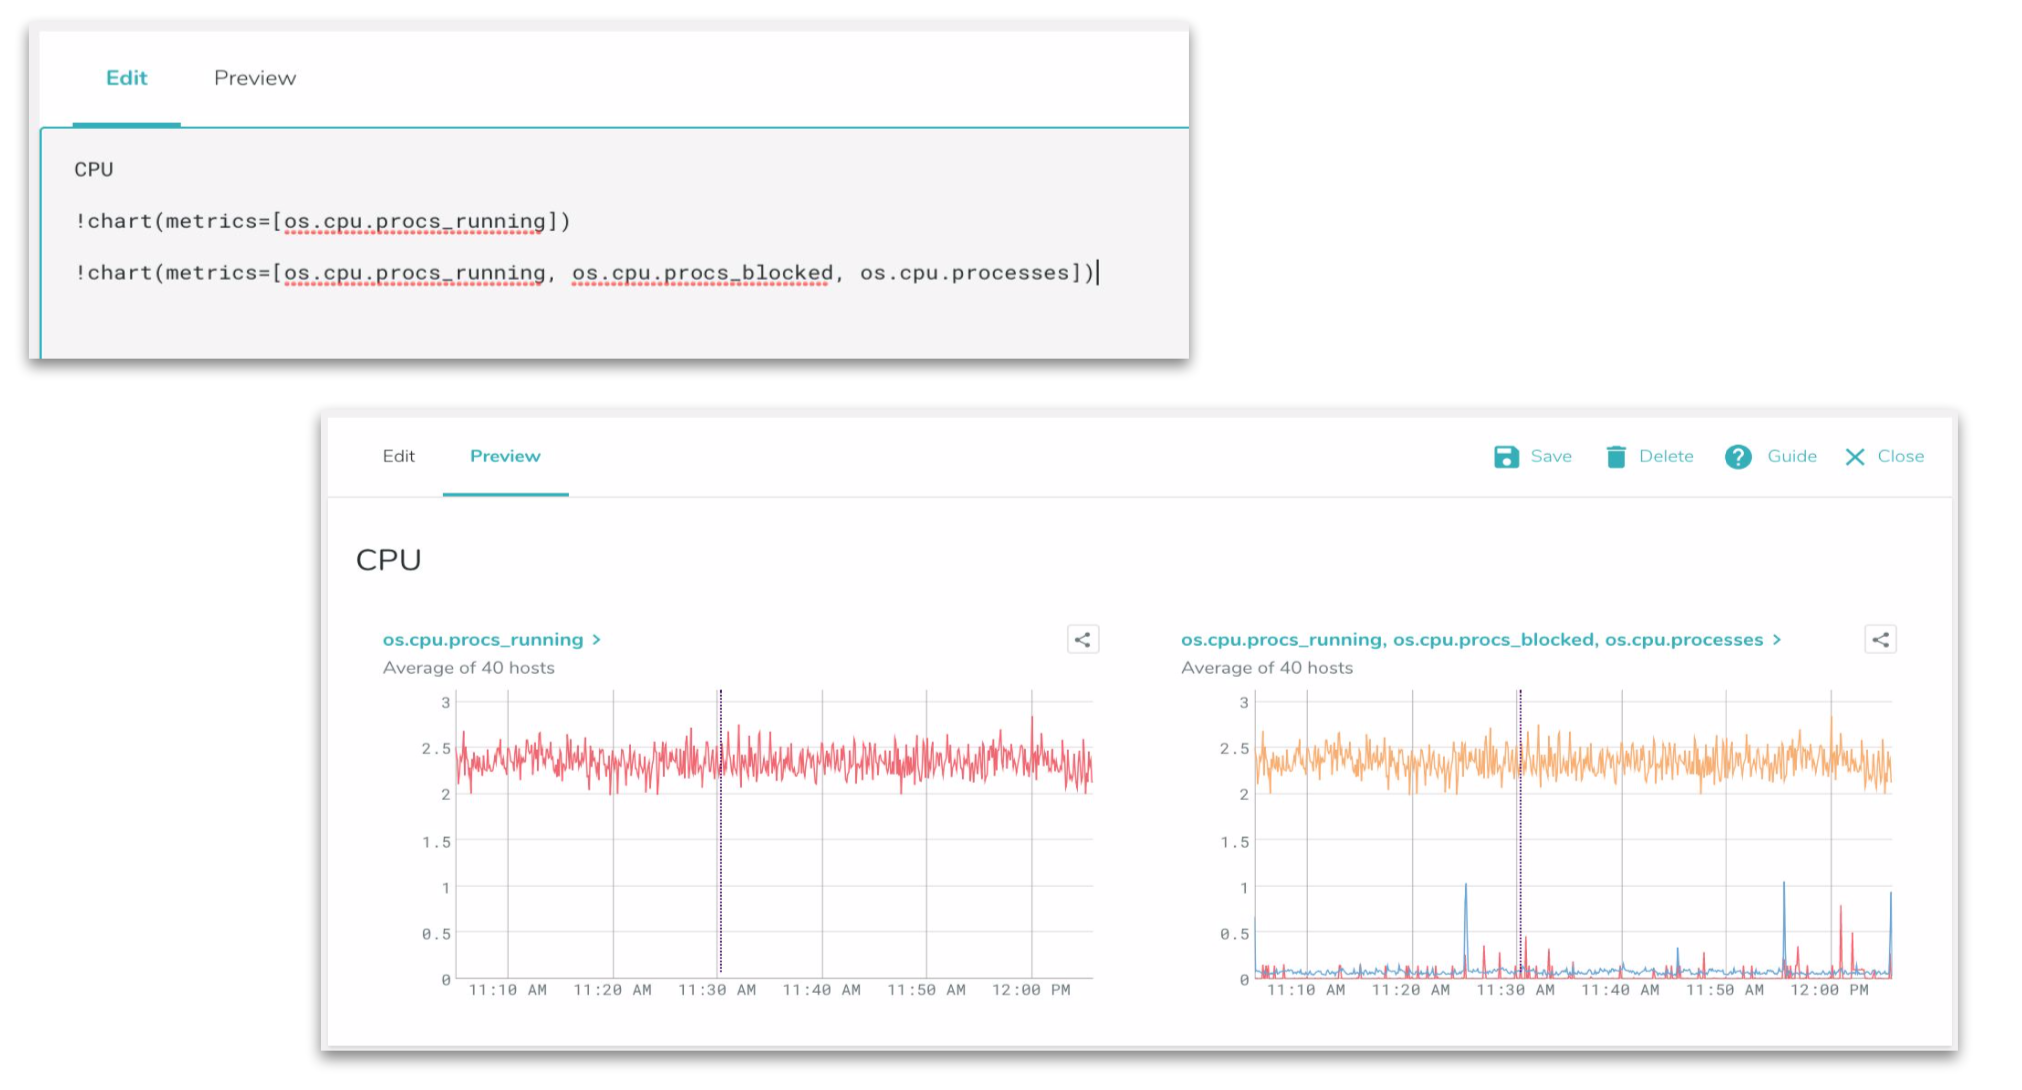
4. Creating New Charts Create custom charts for your dashboard by choosing which metrics are important to you. You can chart a single metric or combine metrics together on a single chart. For example,
!chart(metrics=[os.cpu.procs_running])

!chart(metrics=[os.cpu.procs_running, os.cpu.procs_blocked, os.cpu.processes])
To Learn More or Contact Support
There are two ways to find answers to questions about DPM from within the application. You can get information about the product, how to perform specific tasks, and search Frequently Asked Questions. Or, for hands-on support, you can utilize the in-app chat option.
1. Documentation Within any page you can access Documentation by selecting the Question Mark at the top right within the header menu.
2. Chat support You can reach our support team from any page within the application, through the chat icon at the bottom right.
Application Navigation Key
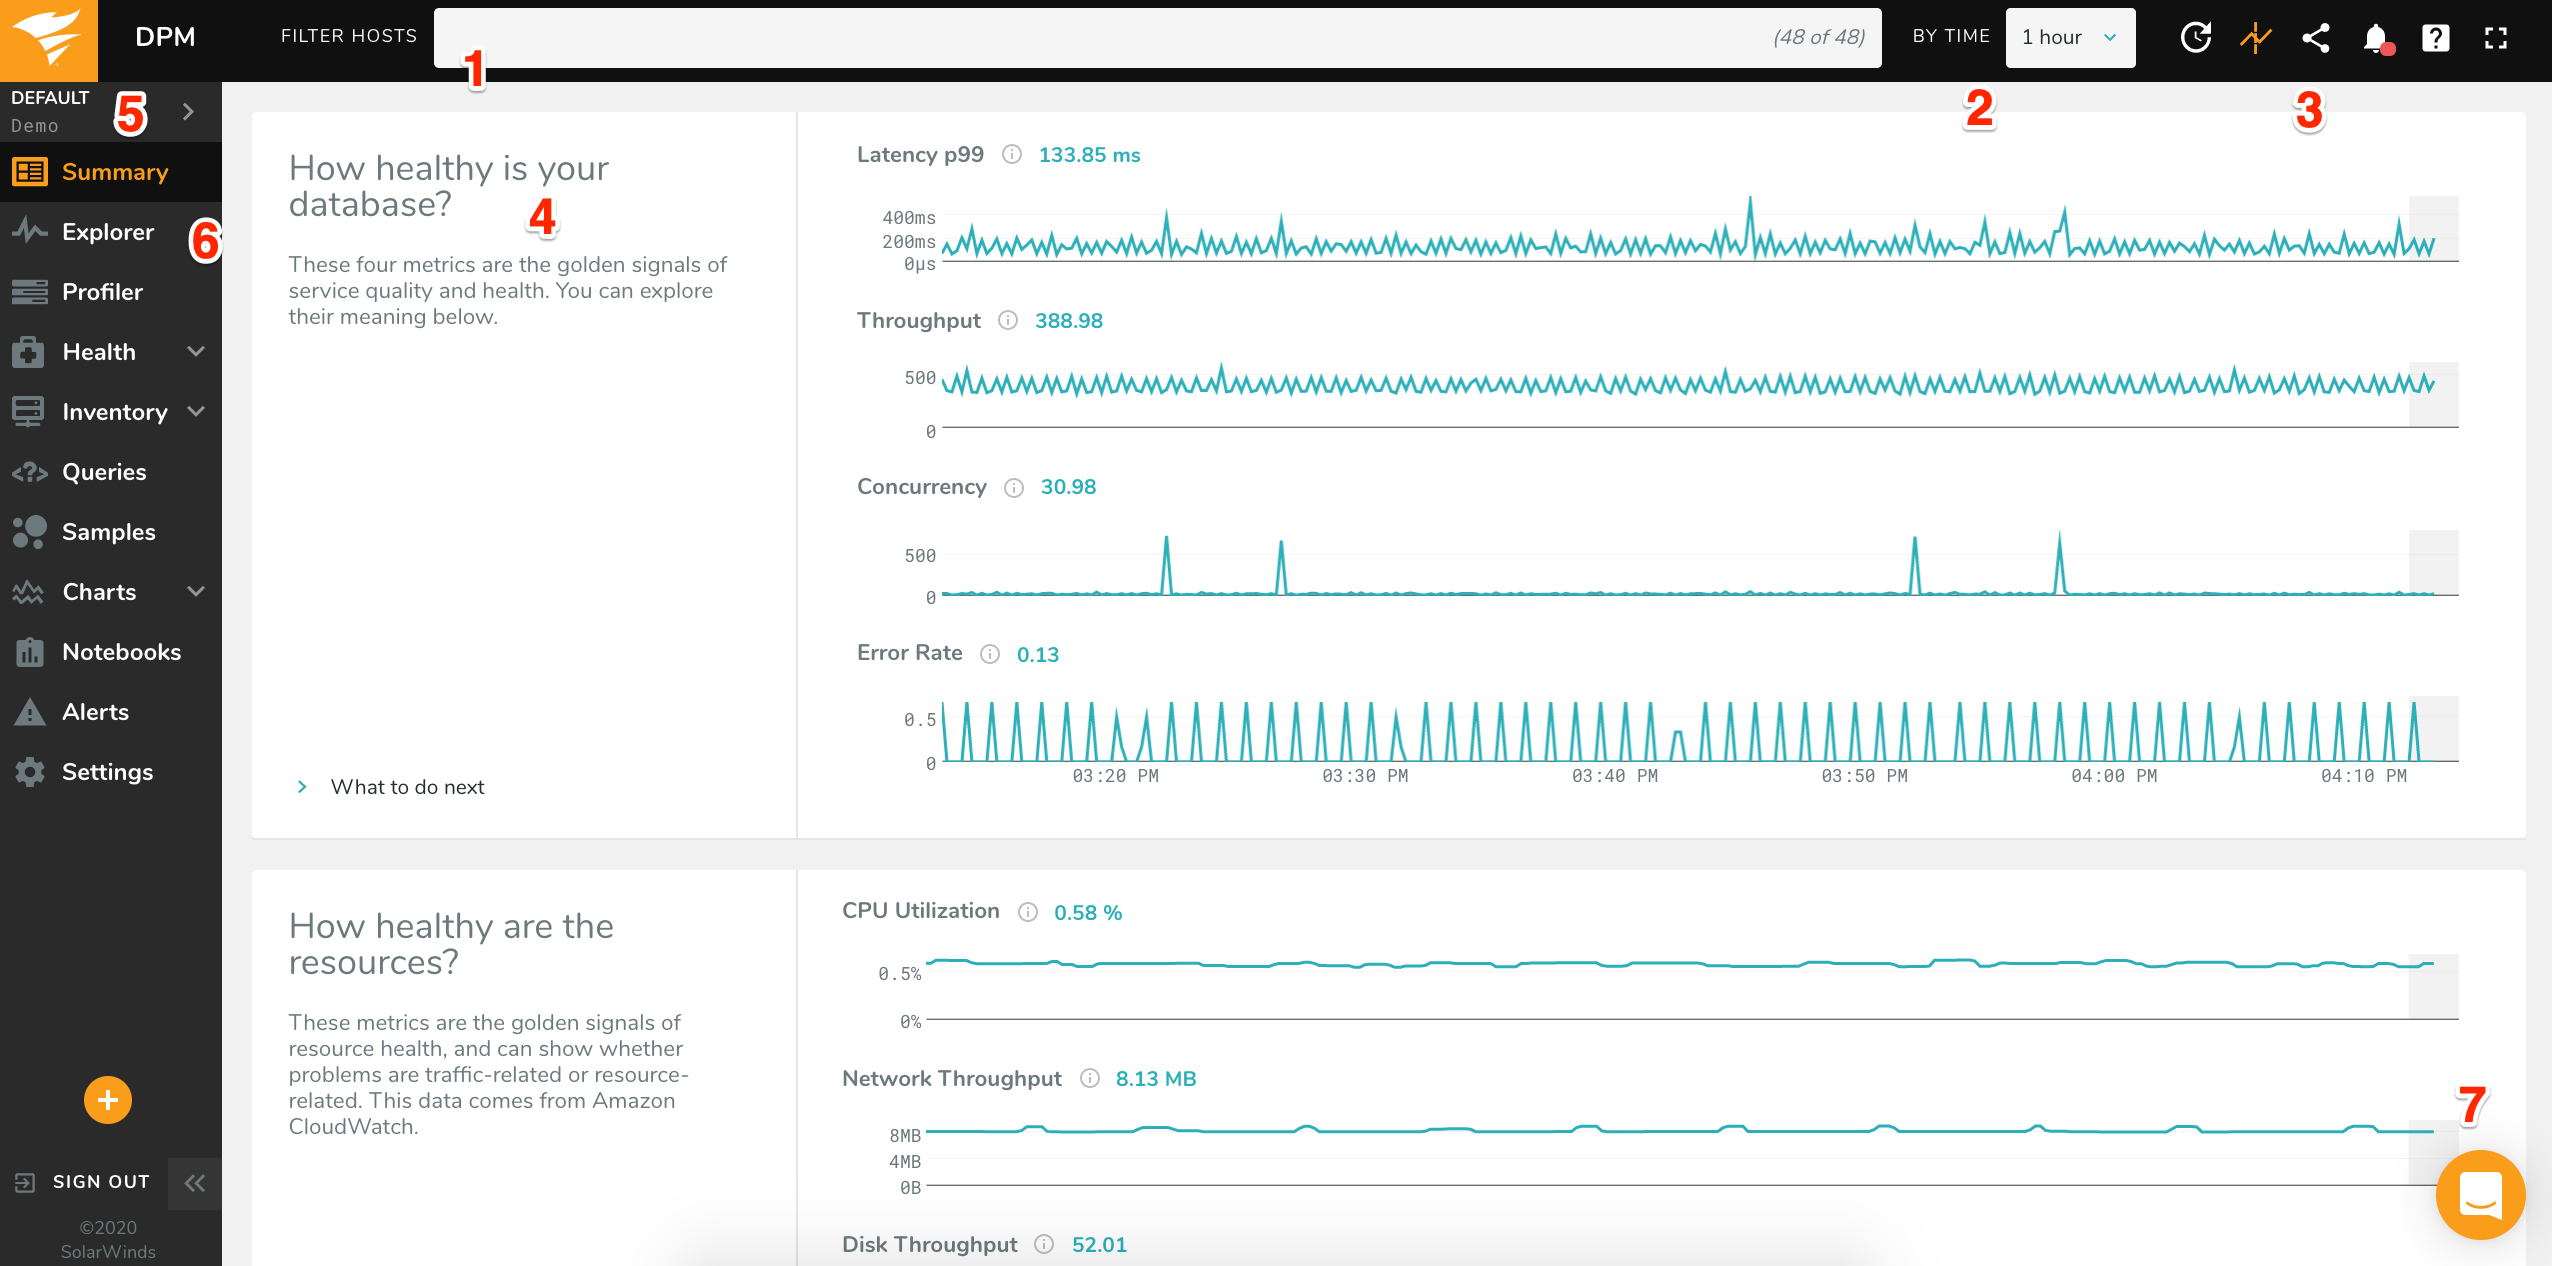
- Filter Hosts: narrow view to a specific host or set of hosts
- Time Picker: controls the amount of history that the application shows
- Additional Features: Auto Refresh, Change Markers, Share Page, Documentation, and more
- Main Interface: the main view of the metrics, based on the selected filters
- Current Environment: the environment where all hosts and data are displayed
Pages in DPM: different views of the metrics and supporting tools:
- Summary: High-level metrics to quickly assess system and resource health
- Explorer: Compare multiple aspects of system performance to see metric relationships
- Profiler: Rank and filter query activity to isolate issues
- Health: See a view of possible issues and faults within systems
- Inventory: View details on active Machines, Groups, and Agents
- Queries: Dig into details, explain plans, and samples of queries
- Samples: Search directly for query samples
- Charts: Customizable and shareable metrics and dashboards
- Notebooks: Use markdown syntax to create data rich documents for saving or sharing
- Settings: Configure and customize the DPM app
Support: In-app chat support, as well as links to system details and documents
Additional Resources
Full Product Documentation at https://docs.vividcortex.com/
Application Status at https://dpm.statuspage.io/
You can also contact Support by using the in-app chat.