VividCortex Grafana Plugin
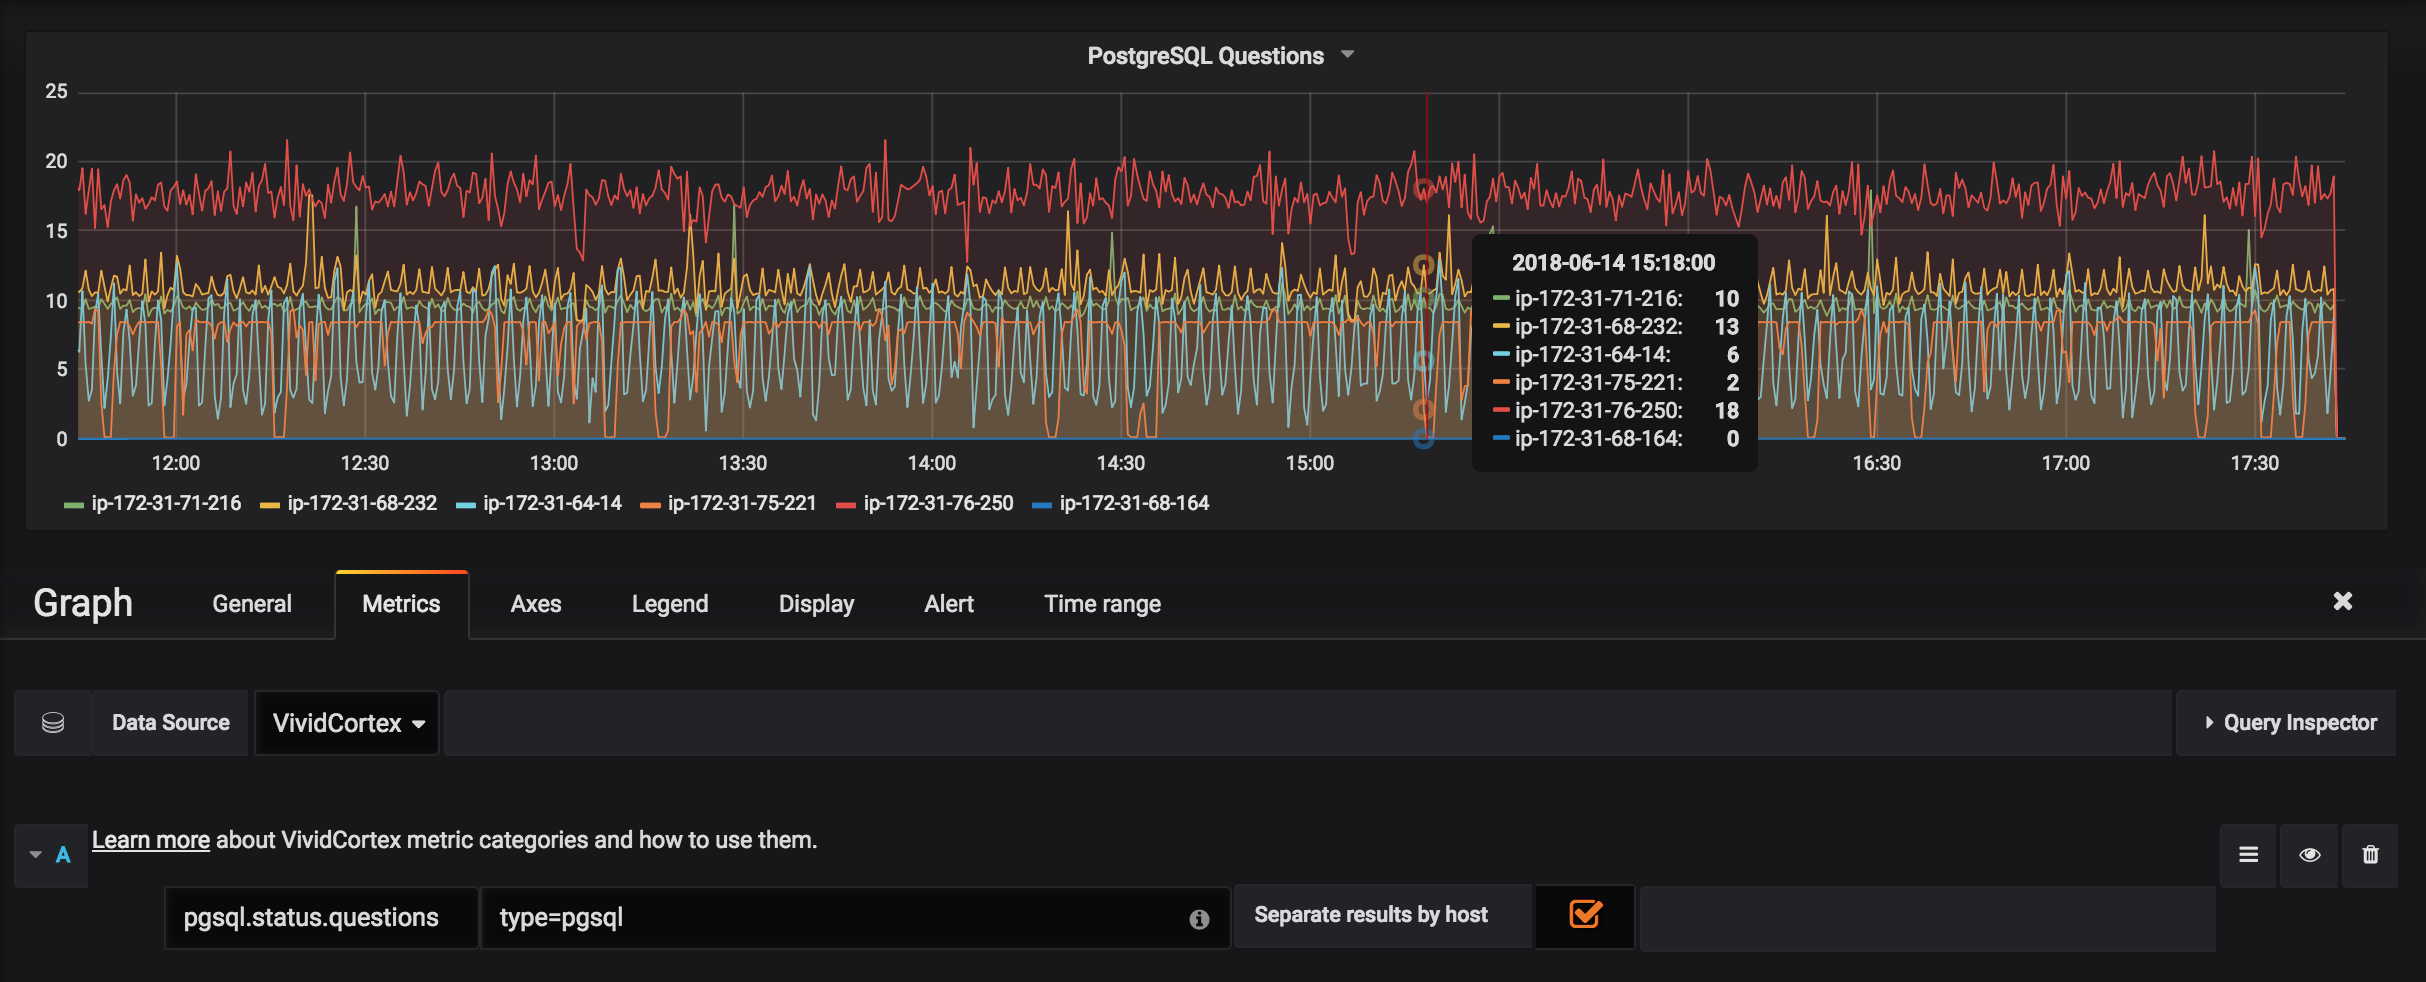
We have released a plugin to integrate with Grafana, the popular open platform analytics and monitoring software. The plugin lets you retrieve and display VividCortex metrics in your own Grafana dashboards. It is currently in open beta, and we would love your feedback.
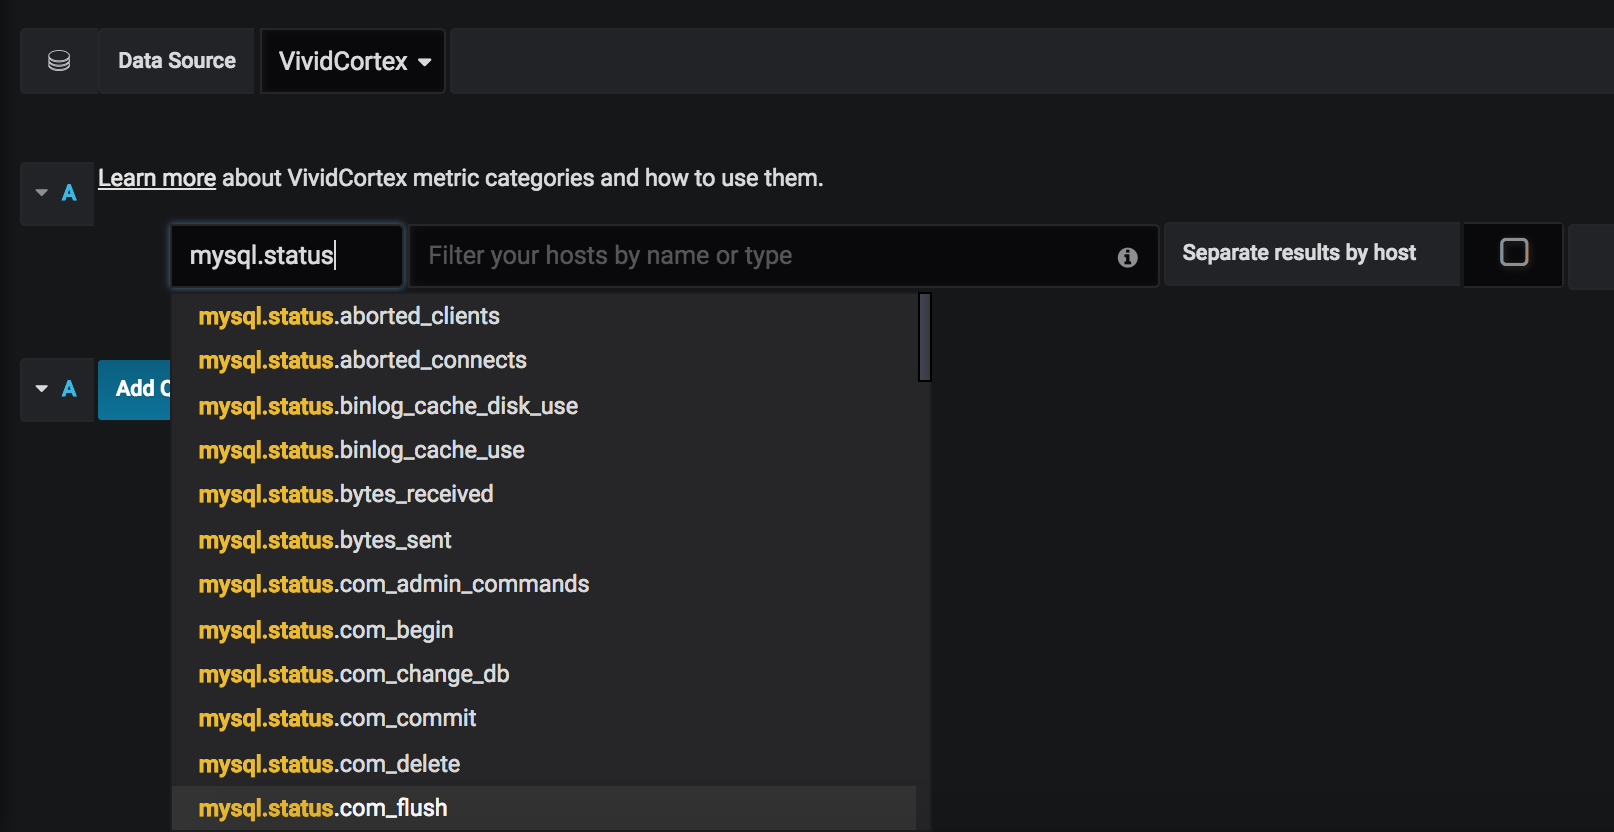
Our Grafana plugin allows you to search for and display any metric that VividCortex collects, including all database, system, and query level metrics. (For more information about metrics and their sources, see our metrics documentation.)
Features include:
- use Grafana’s visualizations to display any metric that VividCortex collects
- autocompletion of metric names
- host filtering by type and name
- graph multiple hosts on a single chart
The plugin is free for any VividCortex customer to download and use. To begin, download the plugin from GitHub and follow the README there: https://github.com/VividCortex/grafana-datasource. You will need an API token, available from the Settings menu within an Environment in the VividCortex web app.


