Change Markers
Change markers allow you to easily see the effect that an event has on your database, by comparing the time that an event occurred, such as a code deployment, with a change in performance.
To see change markers for an event type on charts and sparklines in the app, click the icon in the top-right corner of the application and choose an event category. Each event of that category in the selected timeframe will appear on each chart and sparkline, and will persist as you move throughout the app:
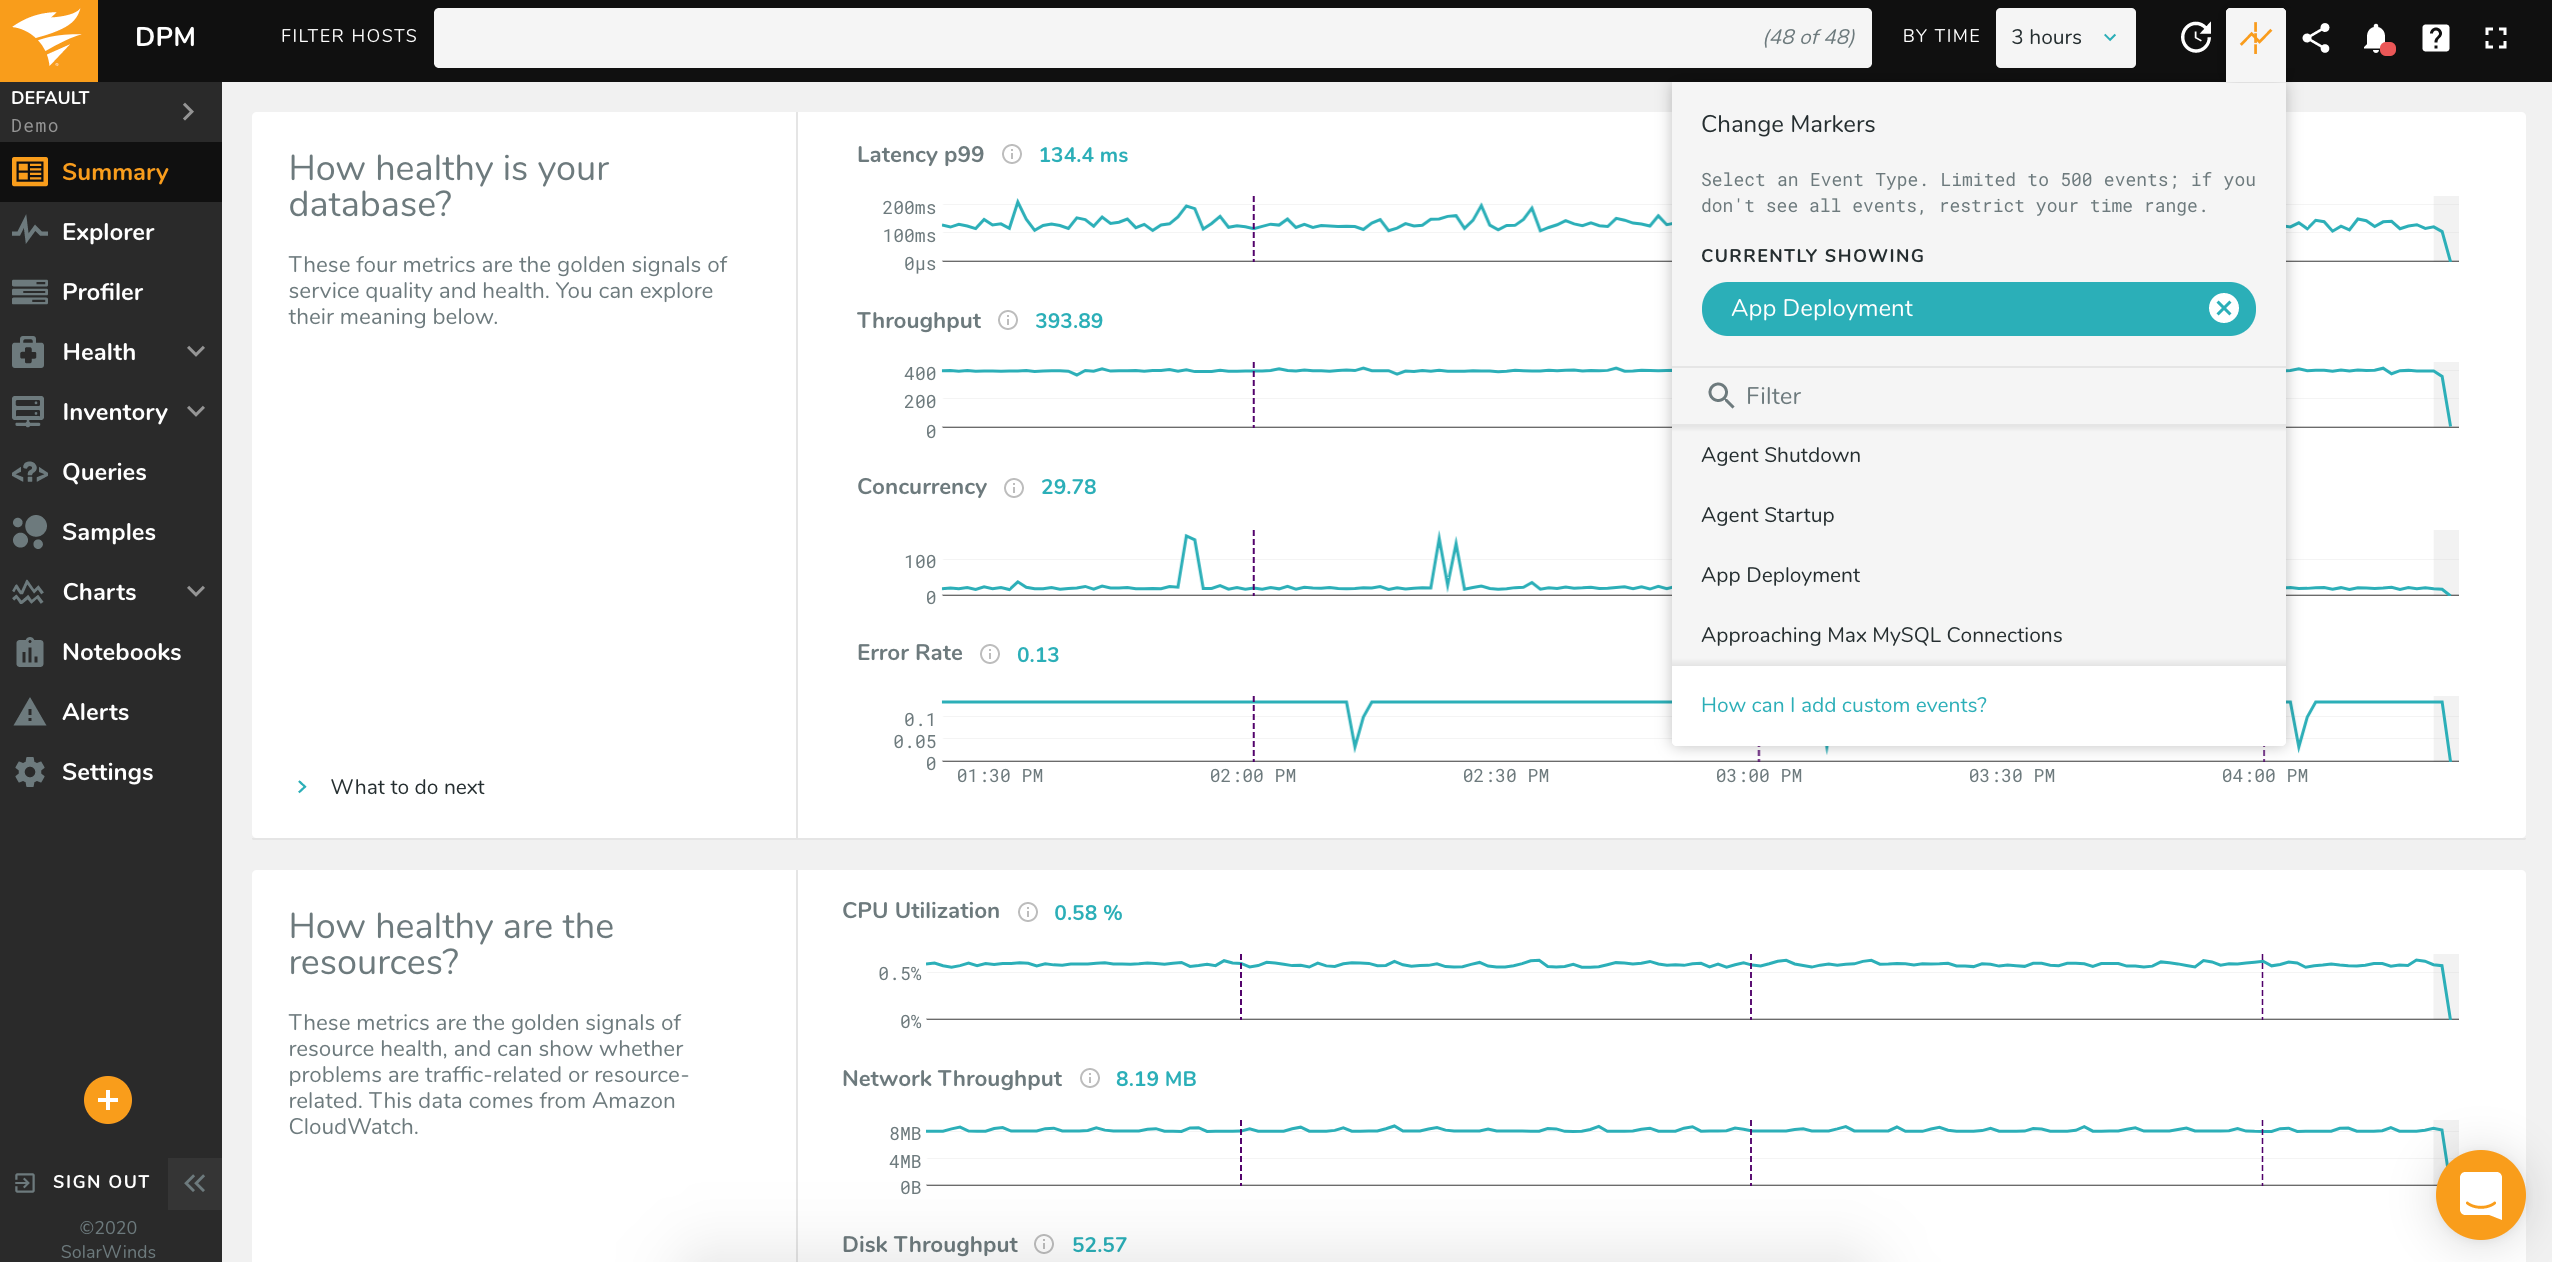
If you select an event type and do not see any markers on charts, your environment did not have any instances of that event during the timeframe; try selecting a different window in the time picker.
Custom Markers
In addition to the events which Database Performance Monitor generates automatically within your environment, you can send custom events to the DPM API, allowing you to see custom change markers on your charts. This lets you easily see what effect these events, such as code deployments, have on your database.
Getting Started
To send an event to the API, you will need the agent’s API token for that environment. This can be found in the agent’s configuration file or through the Add New Host wizard. For example, if you have a “Production” environment in DPM and you want to send events to it, you will need to use the API token from an agent which runs in that environment.
If your event applies to a particular host, rather than to the environment as a whole, you will need the DPM host ID. If your event applies to the environment as a whole, such as a code deployment to every server, you do not need to include the host ID. There are two ways to find the host ID:
- Visiting the Inventory page and hovering the mouse over the name of the host
- Using the API
To fetch the list of hosts in an environment from the API, you can use the following request:
curl 'https://app.vividcortex.com/api/v2/hosts?from=-3600&nest=tags' \
  -H 'Authorization: Bearer <API Token>' \
  -H 'X-Indent: true'
This will return a response in the following format:
{
  "data": [
     {
        "id":132,
        "uuid":"3156bbb284211b36cc5bcbb1920b7a01",
        "created":1454340944,
        "updated":1460575464,
        "deleted":0,
        "lastSeen":1474990286,
        "parent":0,
        "name":"test-db",
        "bindings":[],
        "type":"os",
        "description":"Server test-db version 4.2.5-201.fc22.x86_64",
        "status":0,
        "tags":["db-test"],
        "os":"linux",
        "arch":"amd64",
        "discovered":0
    },
    {
       "id":133,
       "uuid":"60321d6f8e9e930a9039e29dbe8adcf6",
       "created":1454781822,
       "updated":1474990181,
       "deleted":0,
       "lastSeen":1474990280,
       "parent":132,
       "name":"test-db",
       "bindings":["[::]:3306"],
       "type":"mysql",
       "description":"MySQL Community Server (GPL) version 5.6.28-log on test-db listening on [::]:3306",
       "status":0,
       "tags":["db-test"],
       "os":"linux",
       "arch":"amd64",
       "discovered":0
    }
  ]
}
By using the name and type fields you can find the host you want to create an event for.
Creating Custom Events
Sending a custom event to the API can be done with a request like the one below:
curl -X POST https://app.vividcortex.com/api/v2/events \
  -H 'Authorization: Bearer <API Token>' \
  -H 'Content-Type: application/json' \
  --data-binary \
  '{
      "start": 1341446430,
      "host": 132,
      "duration": 60,
      "type":  "Custom Event",
      "level": "info",
      "message": "Here is a custom event I created!"
}'
The above will create a custom event with the following parameters:
start- The unix timestamp the event occurred.host- The DPM numeric ID of the host. Leave unspecified for a global event.duration- The duration of the event, in seconds. Defaults to 0.type- The category of the event, for exampleCode DeploymentorLoad Test1.level- The severity of the event. This can beinfo,warn, orcrit. Defaults toinfo.
Note: host, duration, and level are all optional. An event can be created with only start, type, and message.
A common scenario is creating an event for each code deployment. This allows you to view important database metrics on the Charts page, or query performance in the Profiler or Queries page, and compare before and after the code deployment. Here is a sample request:
curl -X POST https://app.vividcortex.com/api/v2/events \
  -H 'Authorization: Bearer <API Token>' \
  -H 'Content-Type: application/json' \
  --data-binary \
  '{
      "start": 1341446430,
      "type":  "Code Deployment",
      "message": "Reporting SQL v1.2.872"
}'
You can view custom events on charts and sparklines in DPM by using the Events on Charts feature and selecting the category of events you wish to view. You can also view your custom events on the Events page and generate Alerts from them.