Alerts
Mission critical events can happen in your environment while you are away. Our alerting feature allows you to route those alerts to various destinations.
To view the Alerts page for an Environment, click “Alerts” in the left-hand navigation.
We support two kinds of Alerts: Event Alerts, which are generated when an event happens in your account, and Threshold Alerts, which are generated when a metric exceeds a designated threshold.
Basic Configuration
Alerts all have the following attributes:
- Alert Type: The two types, Event Alerts and Threshold Alerts, are discussed below.
- Name: Specify a name for this alert. Alert names must be unique across an environment.
- Alert on Hosts: The host or list of hosts to monitor. You can select individual hosts from the searchable dropdown, and/or you can specify a host tag. Specifying a tag is an easy way to have an Alert stay up to date as you add and remove hosts from your environment. For more information on host tags, see here.
- Annotations: This is an optional field. The annotations field allows you to provide more information about the Alert to the recipients when the Alert is triggered, such as a checklist or runbook.
Event Alerts
As the name implies, these are Alerts which are sent when an Event of the specified type occurs. Events are things like “High Swap Activity” and “Disk Device Full.” For a list of event types which DPM will detect automatically, see our documentation here. You can also send custom Events to our API, which can then be used to trigger alerts.
You can find more information about sending custom Events in our documentation here.
The default configuration will match any Event in your environment; you do not need to select every Event type individually.
Threshold Alerts
Threshold Alerts are based on metrics that exceed a designated threshold. The Alert is generated when the metric crosses the threshold trigger value and has maintained that value for a defined duration of time. Once that duration of time has passed, the Alert activates and a “Threshold Alert” event of a defined level generates. No further Alerts will generate while the original Alert remains in an active state. The active state will be cleared once the metric meets the reset value; from then on, new Alerts can be generated. For a list of the metric categories, see here.
For clients using VictorOps or PagerDuty, when a Threshold Alert resets (i.e. the monitored metric returns to its reset value) we send a resolution event to close the open incident.
For example consider a Threshold Alert with the following configuration:
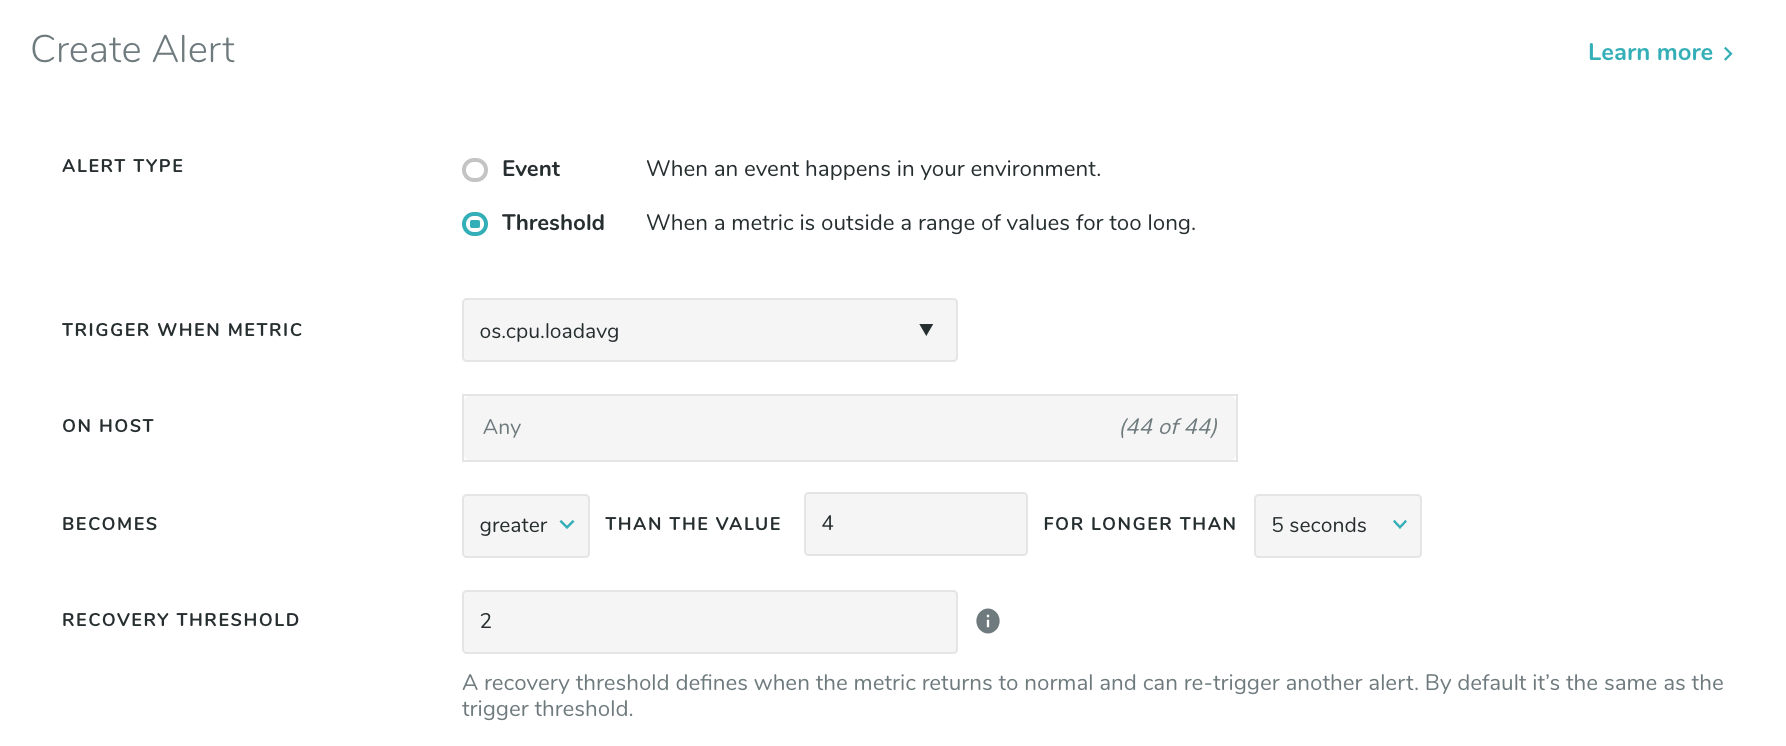
Let’s say os.cpu.loadavg spikes to a value of 7 and stays at that value for 5 seconds. This will generate
a “Threshold Alert” event with level “critical”. Now consider that the value of os.cpu.loadavg drops to 3,
and then rises back to 7 for another 5 seconds. No new Alert will be generated since there is already an
active Alert.
Now consider that os.cpu.loadavg drops down to 1, then goes back up to 7 for another 5 seconds. A new
“Threshold Alert” event will be generated at level “info” when the alert resolves, followed by a second
“Threshold Alert” at level “critical” noting that the Alert has triggered again. A new Alert is generated
since the metric went below the reset value the active state was cleared.
Notification Configurations
Once you’ve configured your Alert trigger, you’ll need to specify how often it can be triggered, and where notifications should go. The “Notify me” setting will allow you to specify a rate-limit on how often an Alert can be triggered, on a per-host basis. In the example below, the configured Alert would trigger at most once every 5 minutes, so unexpected behavior that would otherwise cause a flurry of Alert activity is suppressed. “Immediately” will send an Alert every time.
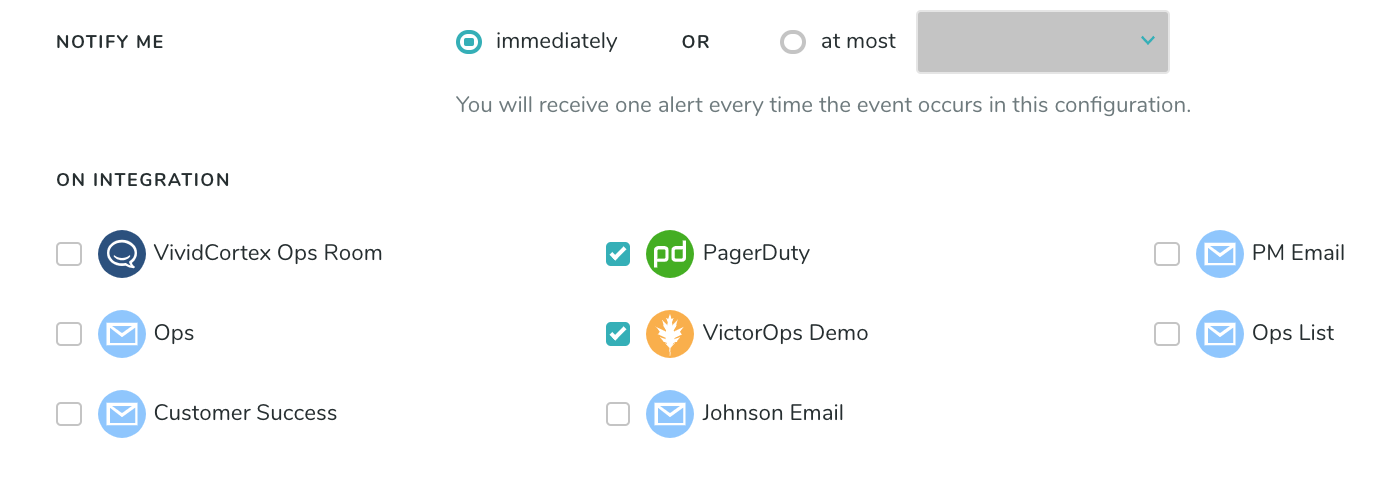
When specifying Integrations to send notifications to, note that multiple Integrations can be added as destinations for each Alert, so multiple groups can be notified by a single Alert triggering in DPM. There is no limit for how many Integrations may be specified as a destination, but at least one must be specified for an Alert to be enabled. For more information on the Integrations, check our Integration Documentation.
Common Alert Scenarios
You may wish to set up an Alert to notify you in the event of the following situations. To do so, simply set up the corresponding Alert:
| Scenario | Configuration |
|---|---|
| The database is down or unreachable. | Use the “Database Connection Error” event type |
| The database is no longer sending metrics. | Use the “Host Stop Sending Data” event type |
| Replication to a secondary has stopped. | Use the “Replication Stopped” event type |
| Replication to a secondary has started. | Use the “Replication Started” event type |
| The MySQL database has reached its maximum connections. | Use the “Max MySQL Connections Reached” event type |
| Replication on a secondary is delayed. | See Monitoring Replication here |
| Long-running queries | Use the Long-Running Query event type |
| High CPU utilization | Create a threshold-based alert using the metric os.cpu.util_pml. This is a permille metric DPM calculates that is the best representation of CPU load. For example, set the threshold to 900 for 90% utilized. |