Samples Explorer
Database Performance Monitor captures raw samples of the queries that are sent to your database, in addition to aggregate query metrics. This provides richer detail into query activity, especially slow queries or queries which generate errors, and also lets you examine execution plans for opportunities for optimization.
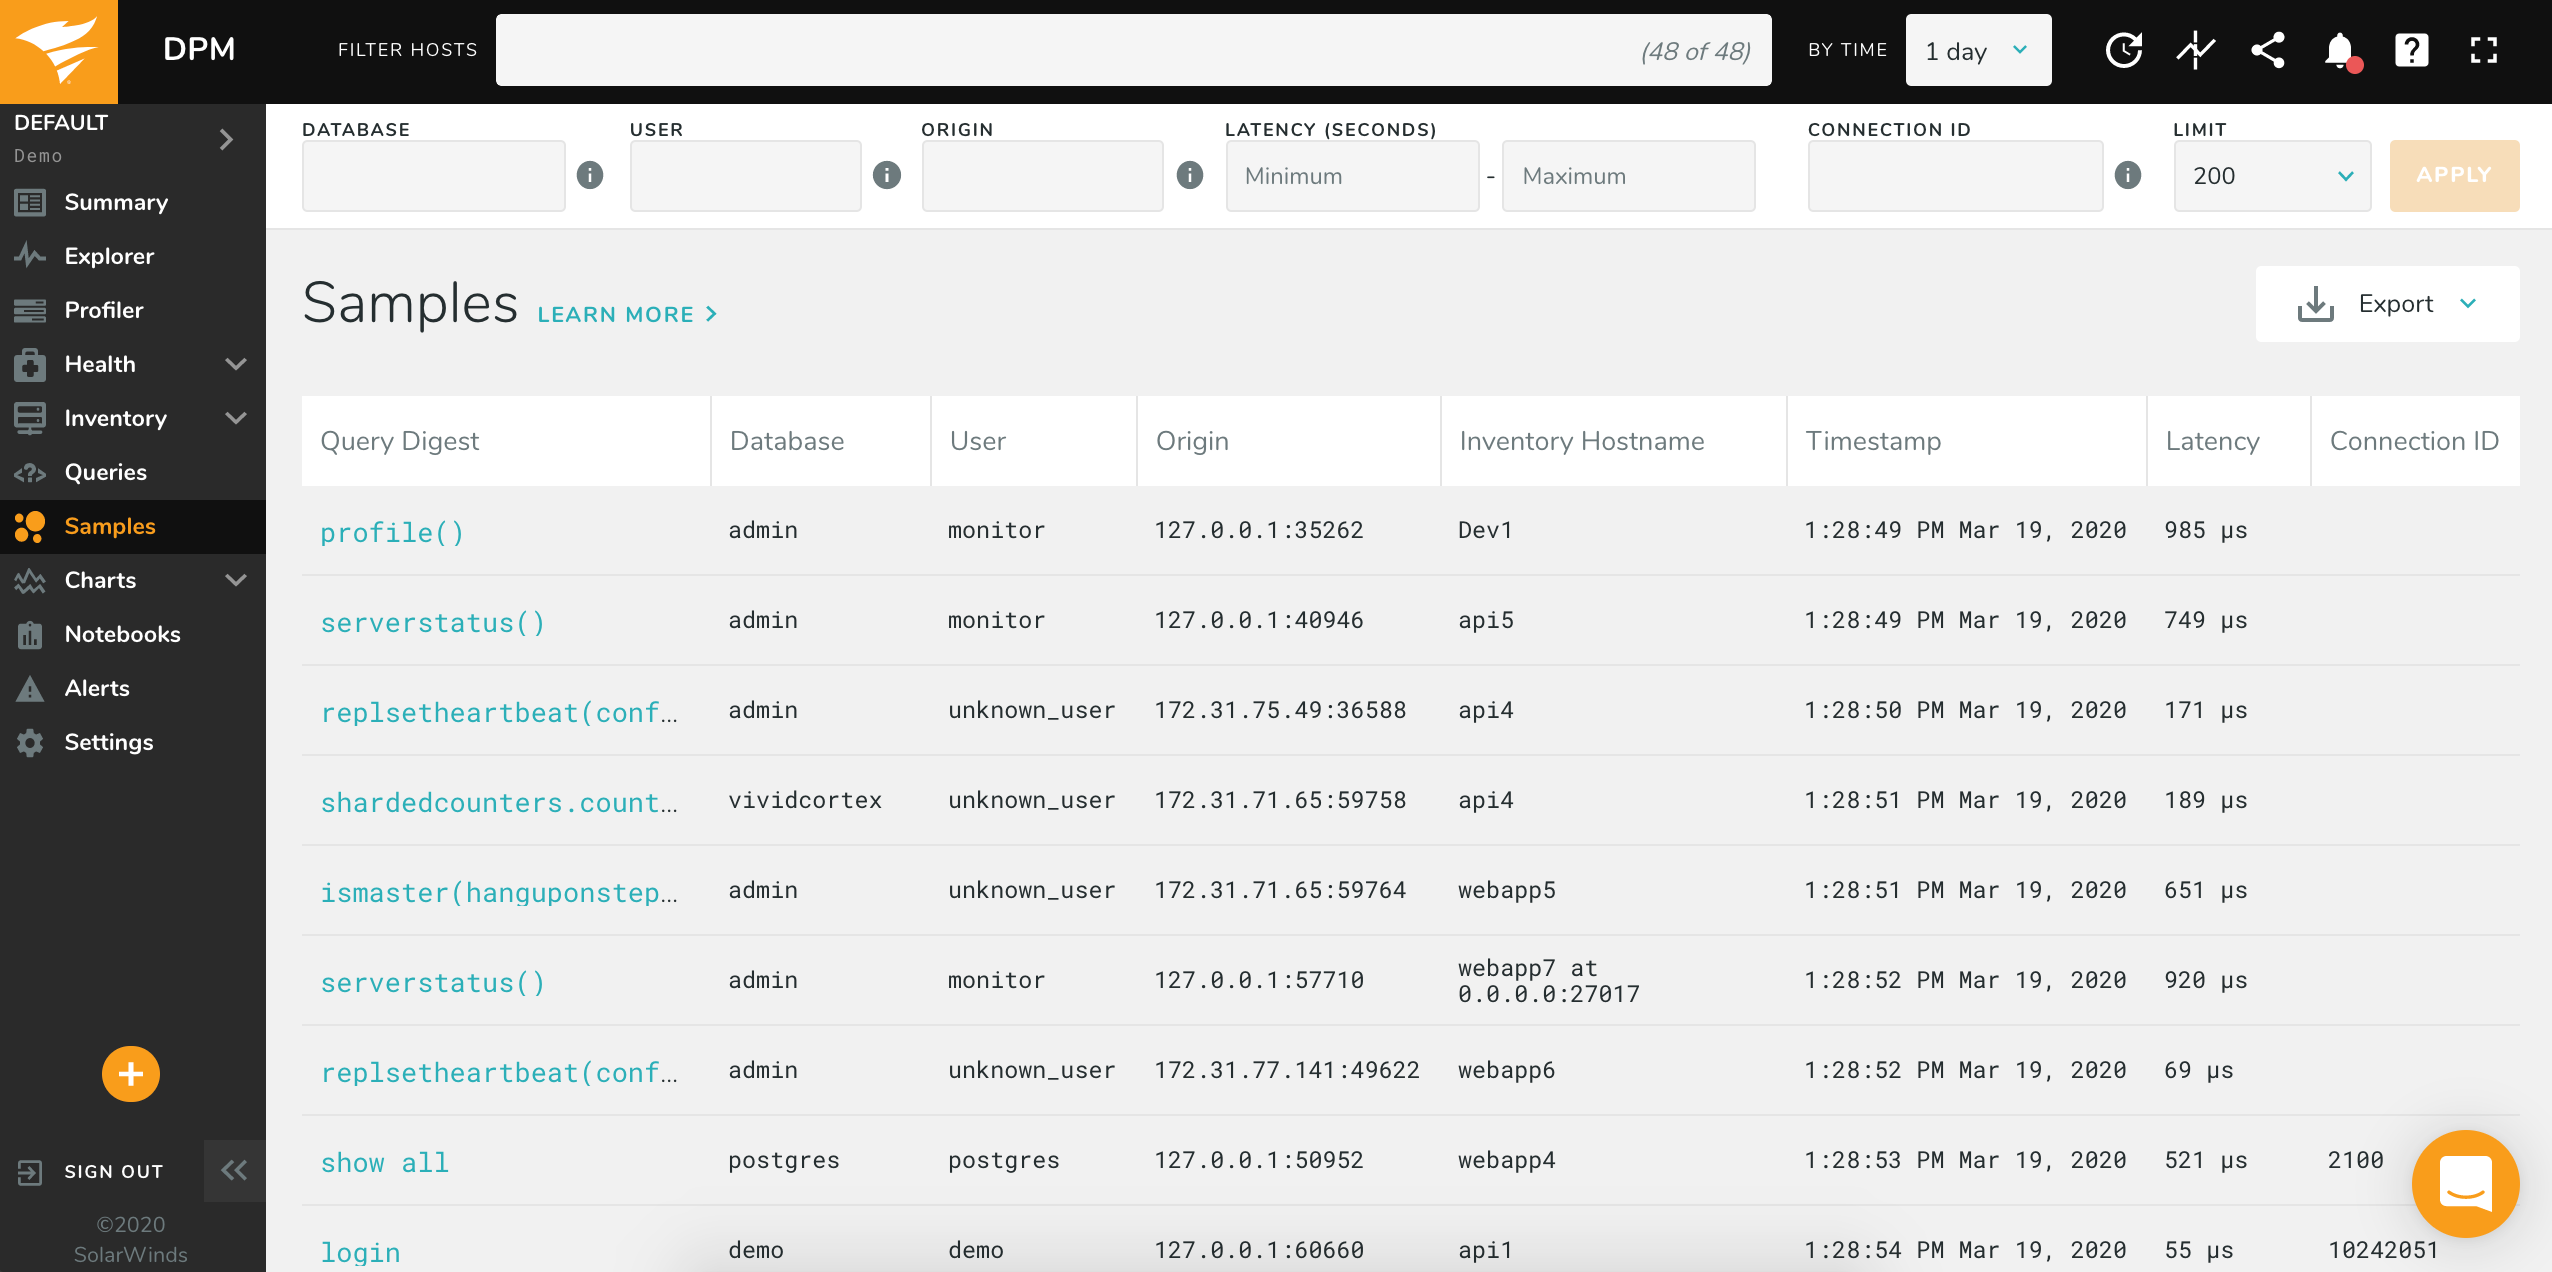
You can use the Samples Explorer to search for query samples directly. Clicking on the query digest will take you directly into the Query Details page for that query.
Note: You will need to have DPM configured to capture query samples to use this page.
The Samples Explorer lets you answer questions like the following:
- What queries did this user run which took longer than 2 seconds?
- What slow queries use this database?
- What queries did this client run?
Using the Samples Explorer
Select a host (or set of hosts) you want to search by using the Host Filter, or leave the Host Filter blank to search for queries executed by any database host. You can select the time frame you wish to search with the Time Selector.
You can search using any combinations of the following fields:
- database: The database the query was executed against, provided either at the time of connection or by using the
USEsyntax. - user: The user that ran the query.
- origin: The IP address and port of the client which issued the query.
- latency: The query latency, in seconds. You can specify both a minimum and maximum.
- connection ID: The connection ID of the query execution.
All fields are treated by default as exact matches, and multiple search parameters are combined with AND. You
can use * as a wildcard; for example us_* would match everything beginning with us_.