Fault Detection
To examine faults Database Performance Monitor has detected, click on the “Health” icon in the navigation pane, and then click “Faults” at the top of the window. A timeline appears, with faults in the architectural layers arranged from left to right. The height of the fault indicates its severity, and the width its duration.
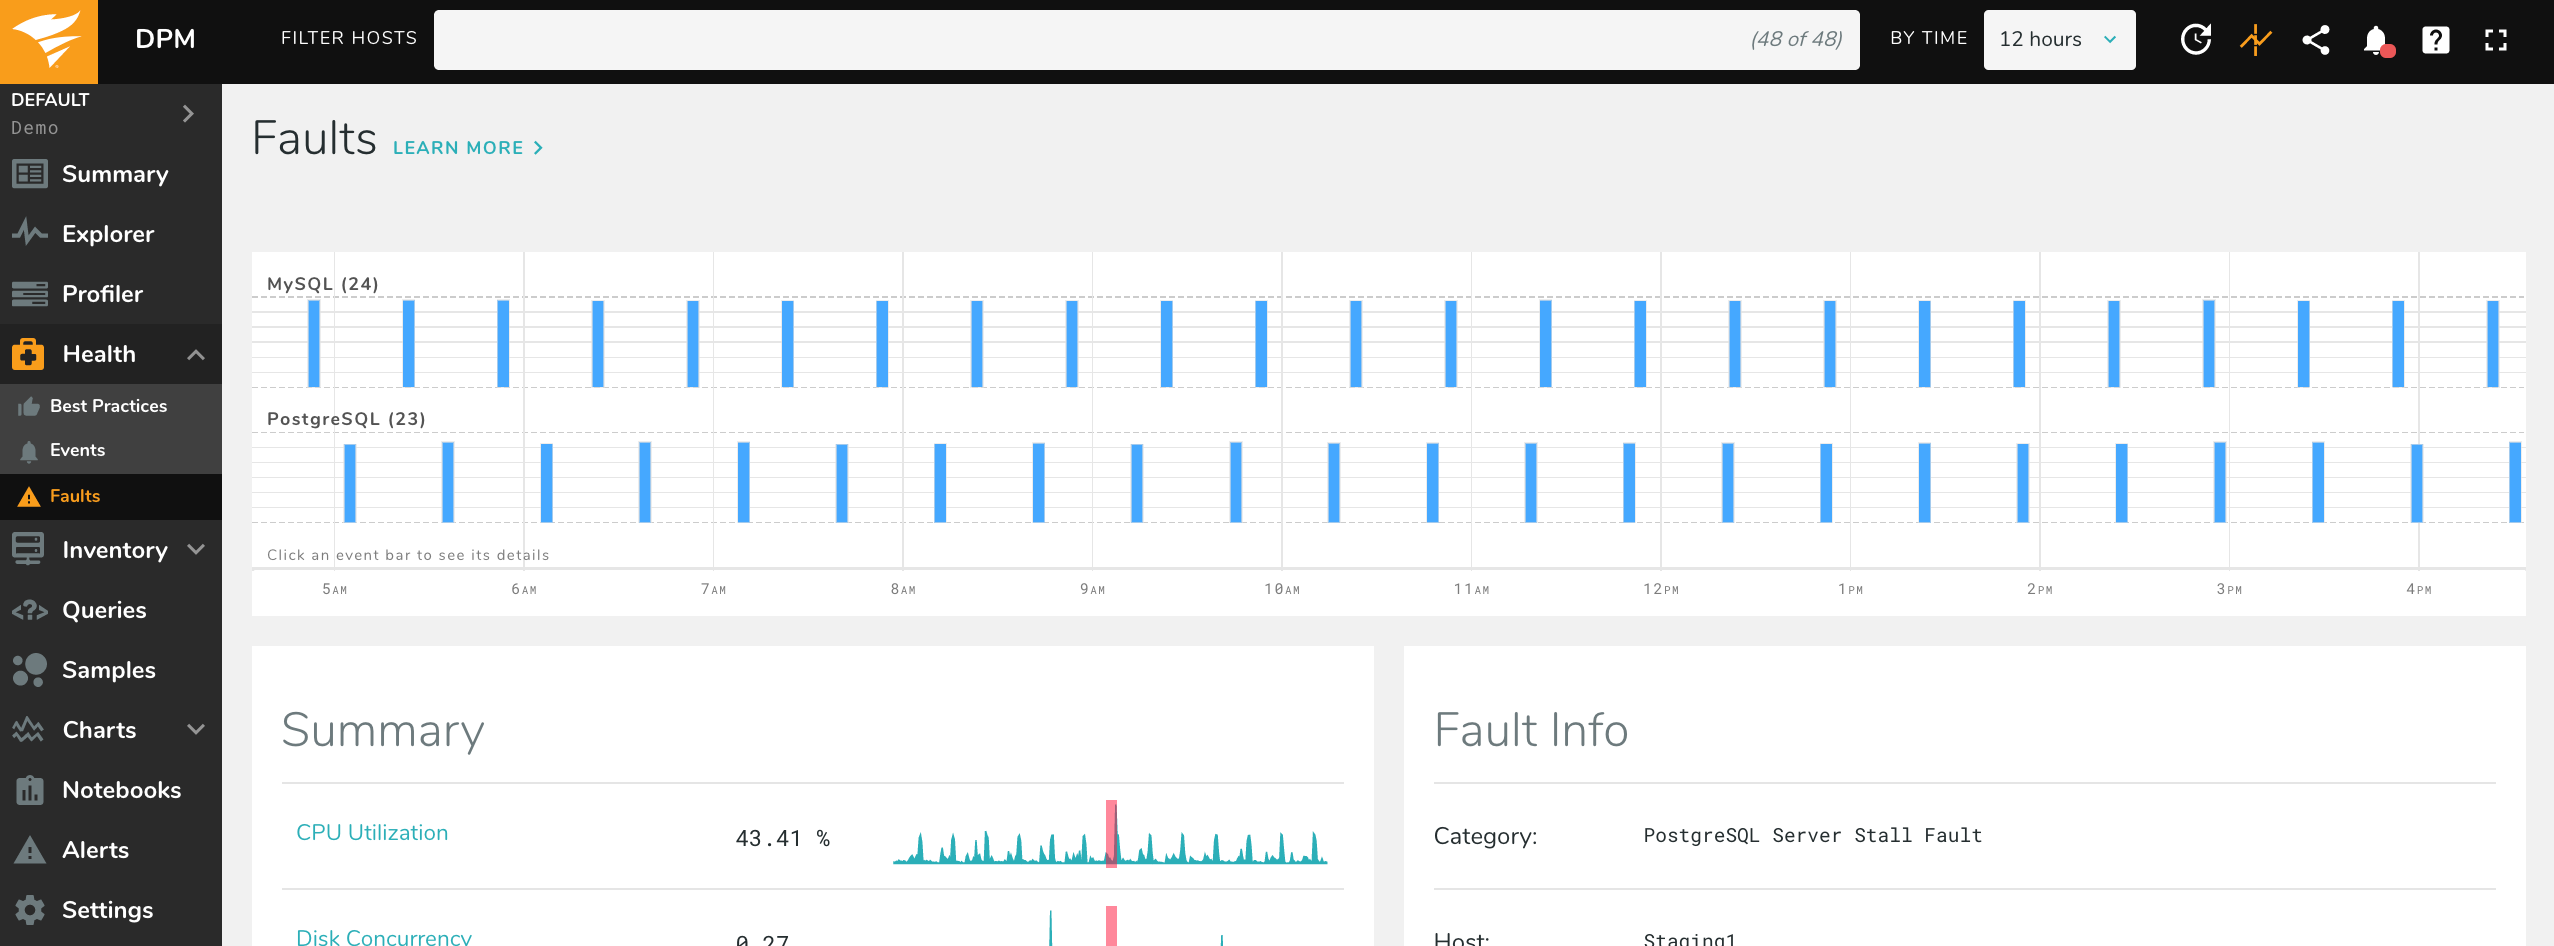
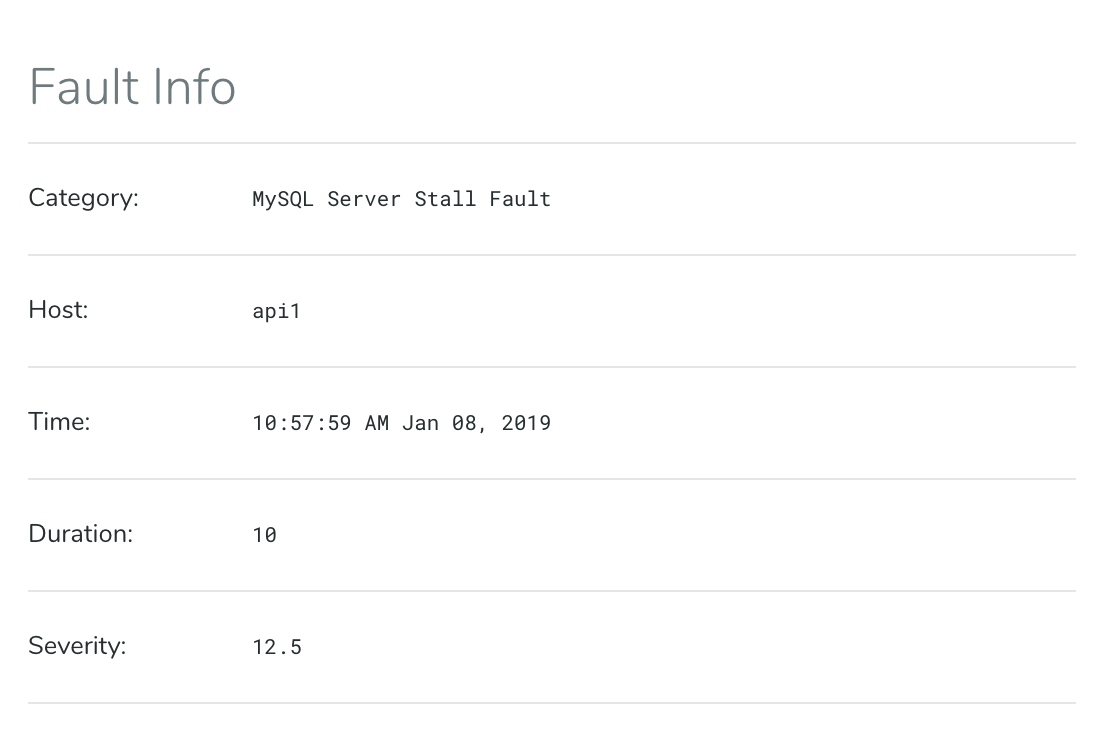
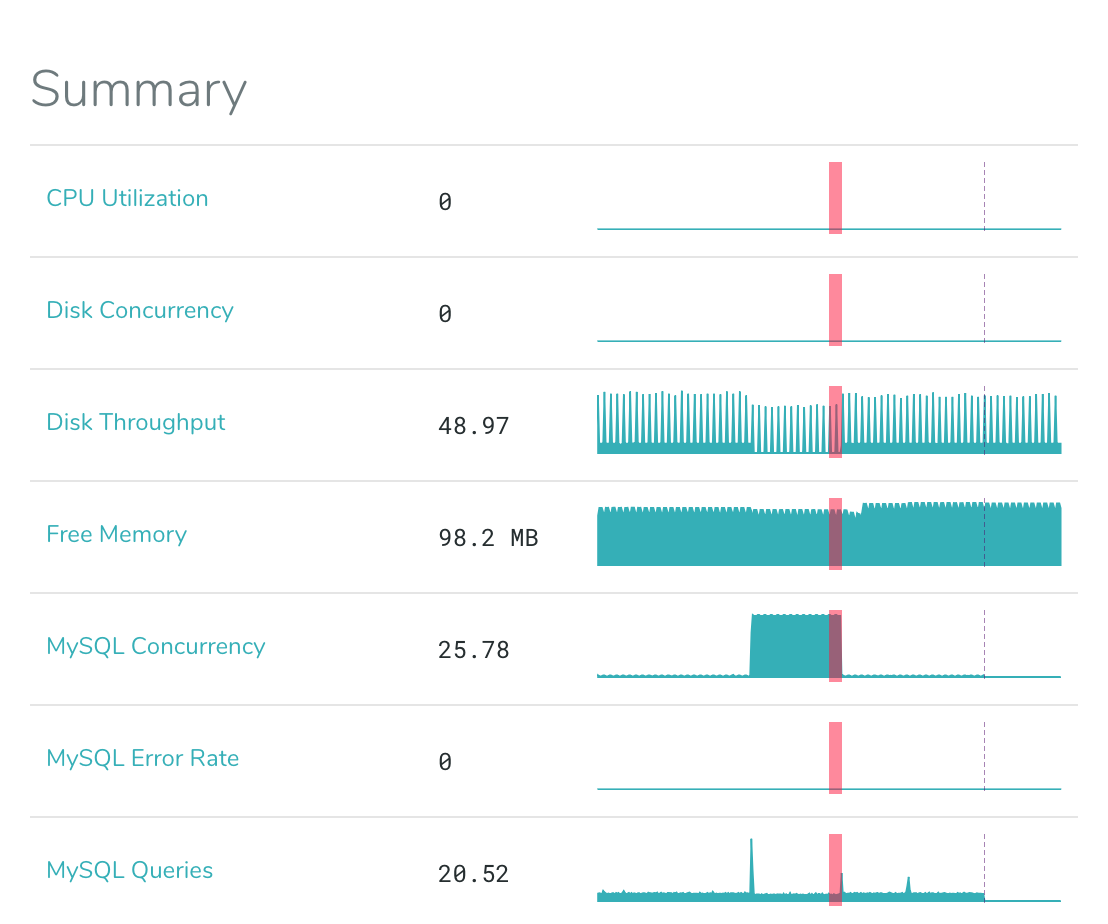
Click on any fault to examine it, and a two-column display appears below. The left-hand pane displays summary information about activity and status in the faulty system during the affected time period, with vertical red lines indicating the moment of the fault.
In the Top Processes widget below the summary, the culprit is visible: a process called clean_metrics.
This is a real example of a fault on one of our servers. The diagnosis requires application-specific
knowledge, but in summary, this application is a background task that executed an expensive DELETE
statement against the database, which then issued a large set of I/O requests to the disk.
Depending on the systems involved, additional widgets will be available with top-N displays of various data such as queries, processes, and network connection states.
What is Adaptive Fault Detection?
Adaptive Fault Detection is a patented technology to find small interruptions to server or service availability. A fault is best described as a small stall, where requests for work (queries, IO operations) continue to arrive but are not being serviced. Finding faults while they are small can avoid serious outages later.
Faults are typically caused by system overload or poor performance. Because they are nearly impossible to detect by normal means such as threshold-based alerts, they are often hard to find until they become major problems (seconds or minutes of downtime). They are some of the most difficult problems to diagnose, because of their transient nature, which makes them hard to observe. The symptoms and causes tend to be complex, because systems that stall often misbehave in a variety of ways simultaneously.
For these reasons, faults are best detected while they are small (a second or two). Short-duration
faults are much easier to diagnose and fix. Typical causes include resource overload, storms of
queries, bad application behavior, SELECT FOR UPDATE or other locking queries, internal scalability
problems such as mutex contention around a long-running operation, or intensive periodic tasks.
For example, the query cache mutex in MySQL has caused server stalls, and InnoDB checkpoint stalls
or dirty-page flushing can cause similar effects. In the application layer, bad behavior such as
stampedes to regenerate an expired cache entry are common culprits.
There are thousands of potential causes for stalls, and it is impossible to guess what metrics and thresholds might predict them. Our fault detection algorithm is based on queueing theory, and observes work requests arriving, in progress, and completing. When work queues up and does not complete, the system is stalled. This algorithm is completely adaptive and requires no tuning, and because the definition of a fault is based on work being completed, will detect any problem that prevents the system from doing its work, even those we have never seen or imagined.
When a fault occurs, our agent reacts in real-time by gathering additional data at high frequency. We detect faults in the database server and in the storage (disk) subsystem. Faults appear as events in the Events page, and there is an interface specifically designed for investigating and diagnosing them.
Each fault is assigned a severity, which is a measure of abnormality. It’s similar to a z-score, and a severity value can be thought of in units of standard deviation. The exact definition of severity varies by fault and system type, so severities should only be used for comparisons between similar kinds of faults. For example, severities for disk faults should only be compared to severities of other disk faults.