Profiler
The Profiler allows you to see the most time-consuming and frequently executed queries in your database, in addition to a wide variety of other data Database Performance Monitor collects.

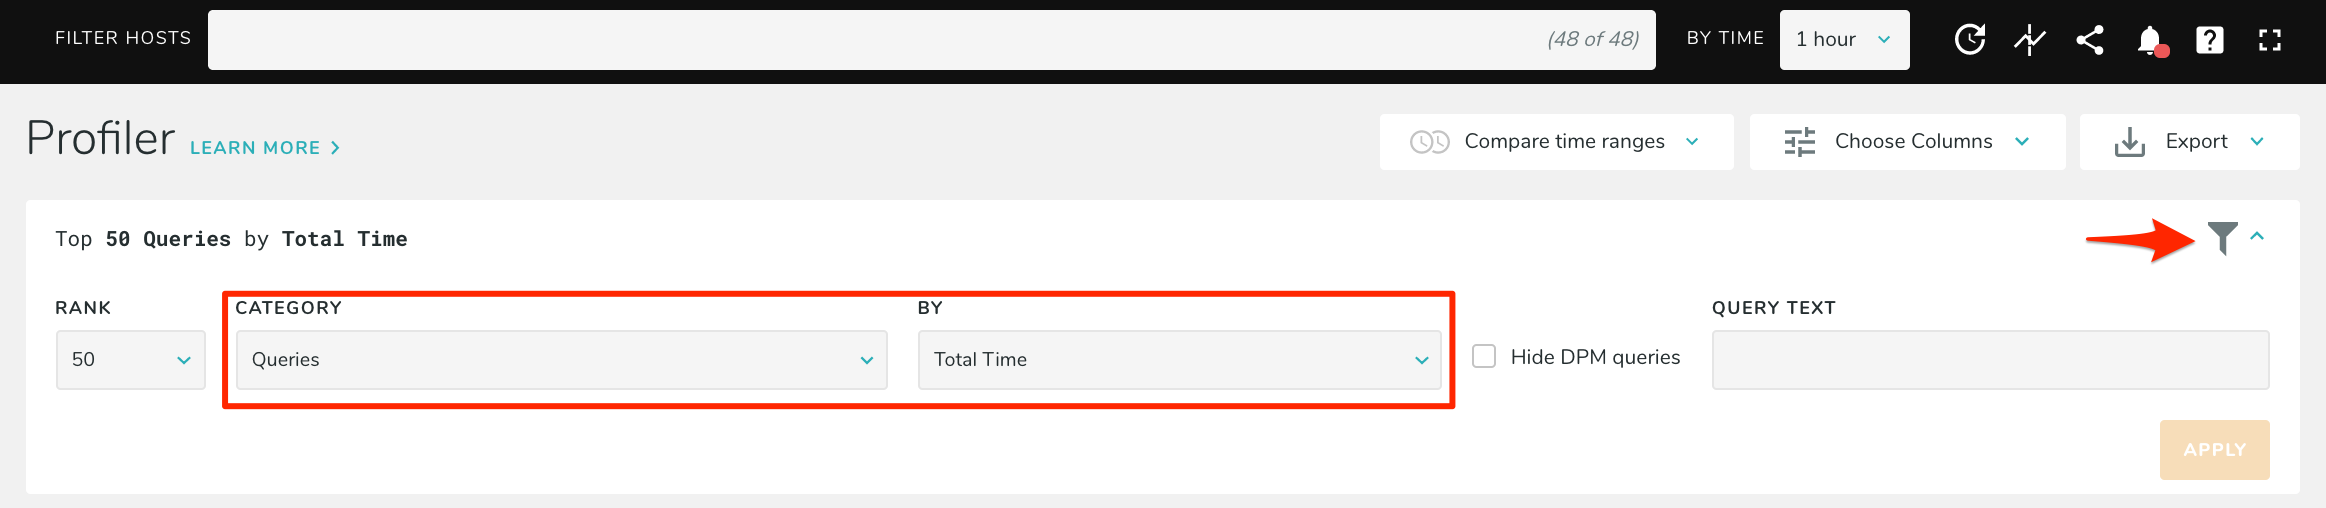
By default, the Profiler ranks “Queries” by “Total Time,” grouping queries together by digest, and shows the total accumulated time for each digest family of queries. This helps you find out which queries consume the most execution time, which is a useful way to find queries that add load to the servers or make your application respond more slowly to requests.
To change what category of data is being displayed, select an option from the drop down in the navigation bar:
Query Search & Tag Filters
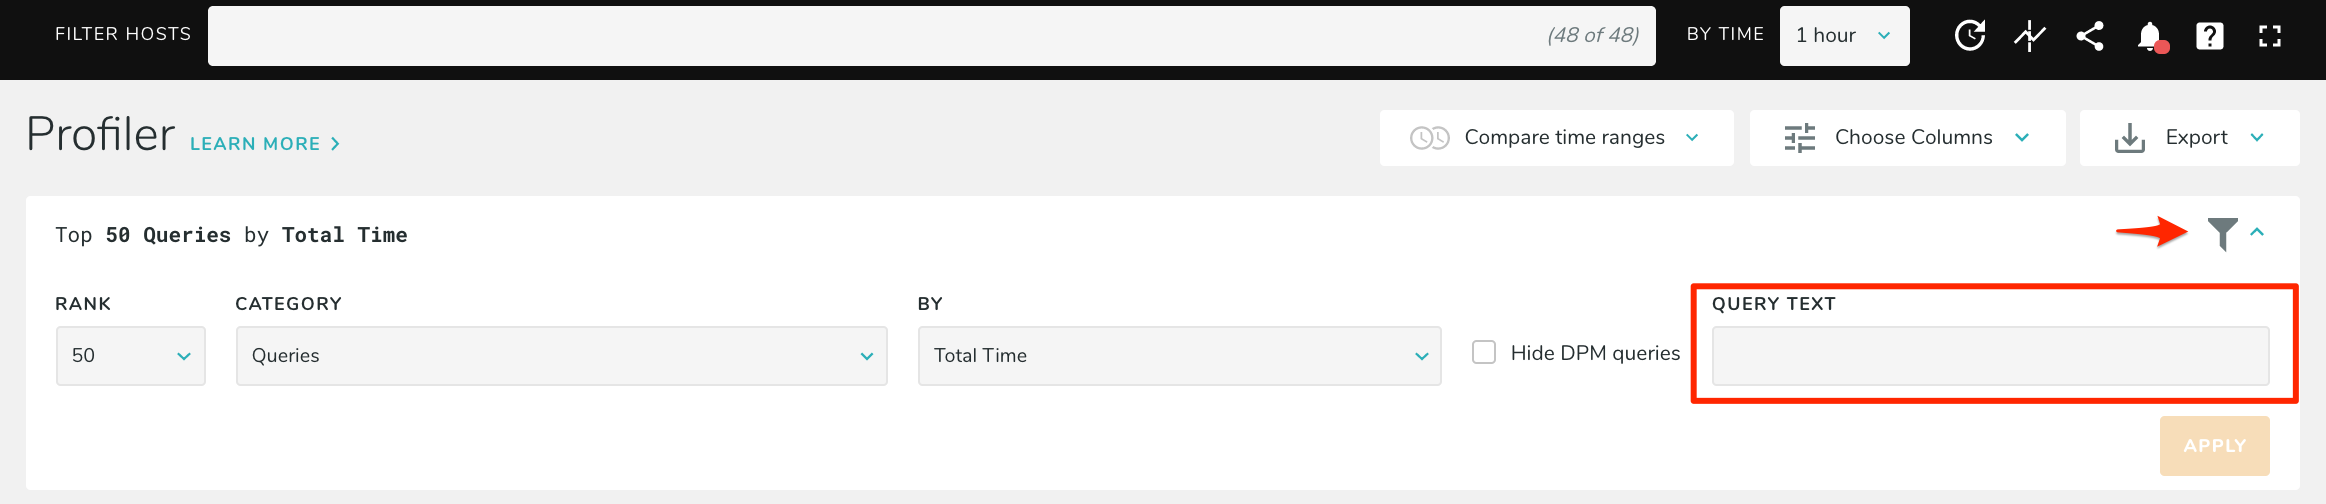
When ranking Queries, it is possible to search for a specific query digest (or part of a digest). Installation using packet sniffing can also filter by Query Tags.
To search, just enter the search text in the Filter by Query Text box:
Two special characters are accepted:
*will match any number of any characters. For example,select * customerswill find any query which contains the wordselectfollowed by the wordcustomersanywhere in the digest. To match a literal*, you can escape using\; for example,select \* from customers.^will match the beginning of the digest. For example,^insert into customerswill find all digests which begin withinsert into customers. As in this example, this is useful to find all queries with a specific query verb which affect a certain table.
To filter using query tags, enter a tag key, value, or key=value pair in the ‘Query Tags’ field and press enter. For example, you can filter by app, mobile, or app=mobile to see query families which had at least one execution with the tag. For more information, see our Query Tags documentation. Note that this is only available when monitoring a database with packet sniffing (“on-host”) or when samples are available from a remote database (“off-host”).
Clicking on any query will navigate to the query details page.
Compare
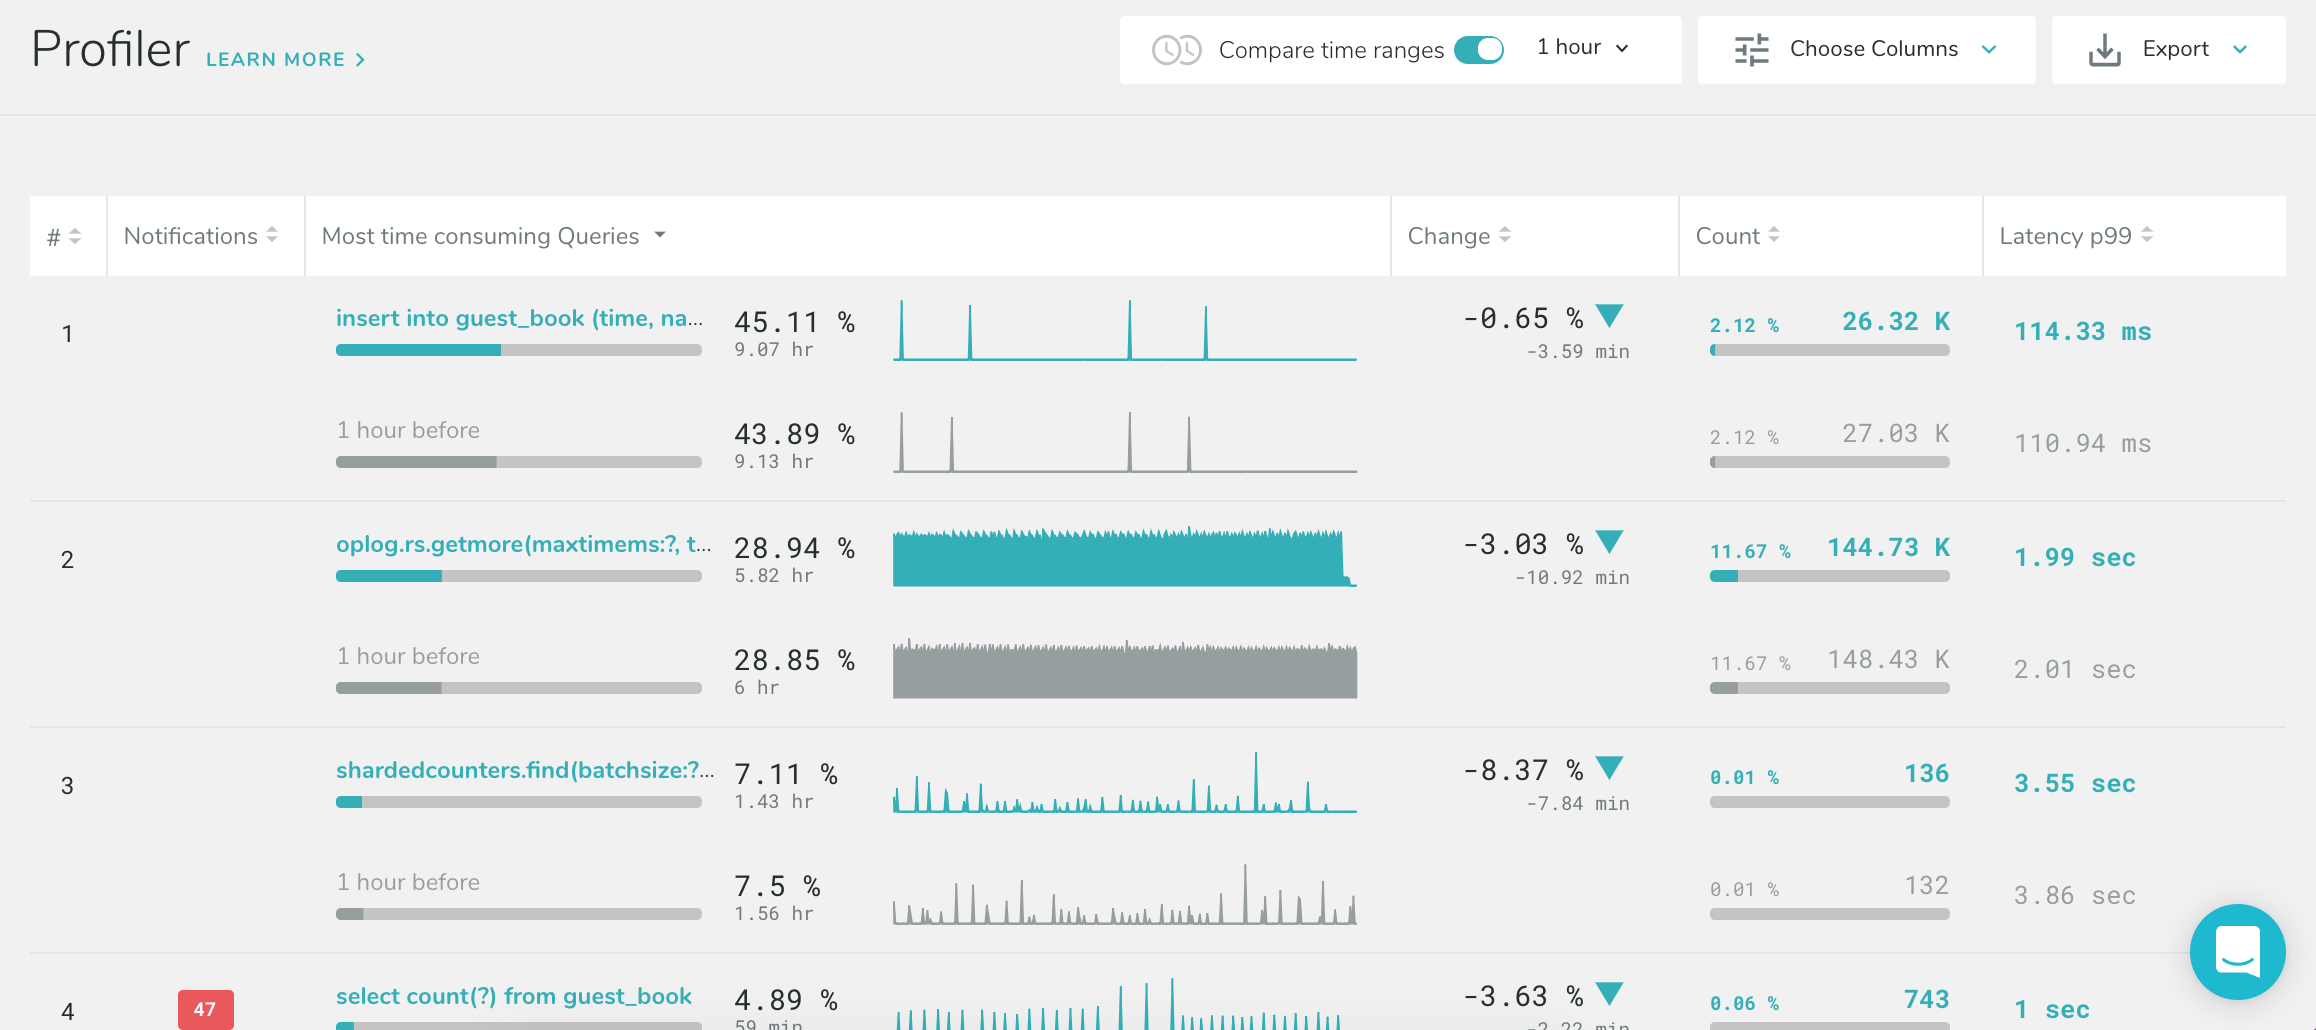
Compare lets you compare data across two selected time ranges. This is useful for determining how queries (or any of the other categories) have changed over time. This view provides a quick way to answer the question “what’s different?” when a server starts to behave differently, or to look at before-and-after behavior of your database workload after a change to an application or an event such as a product launch. The image below shows a one-hour view of the profiler compared to an hour prior.
To enable this mode, select the “Compare” toggle in the navigation bar:

Then select a recent timeframe you want to compare to some time in the past, such as the past hour:

Then select the the time in the past you wish to compare against, such as the day before, by clicking one of the seven time options underneath the slider:

You may see more rows than you expected in the results. For example, if you compare the top five queries from today with a week ago, you may get up to ten queries returned. This is because we show the top queries from each time period; if the top queries from each time period are the same, you’ll get those five returned. However, if some queries which were in the top five are no longer in the top five, we’ll show those as well in order for you to get a complete view of anything that has changed in your database.
Wait Time Analysis
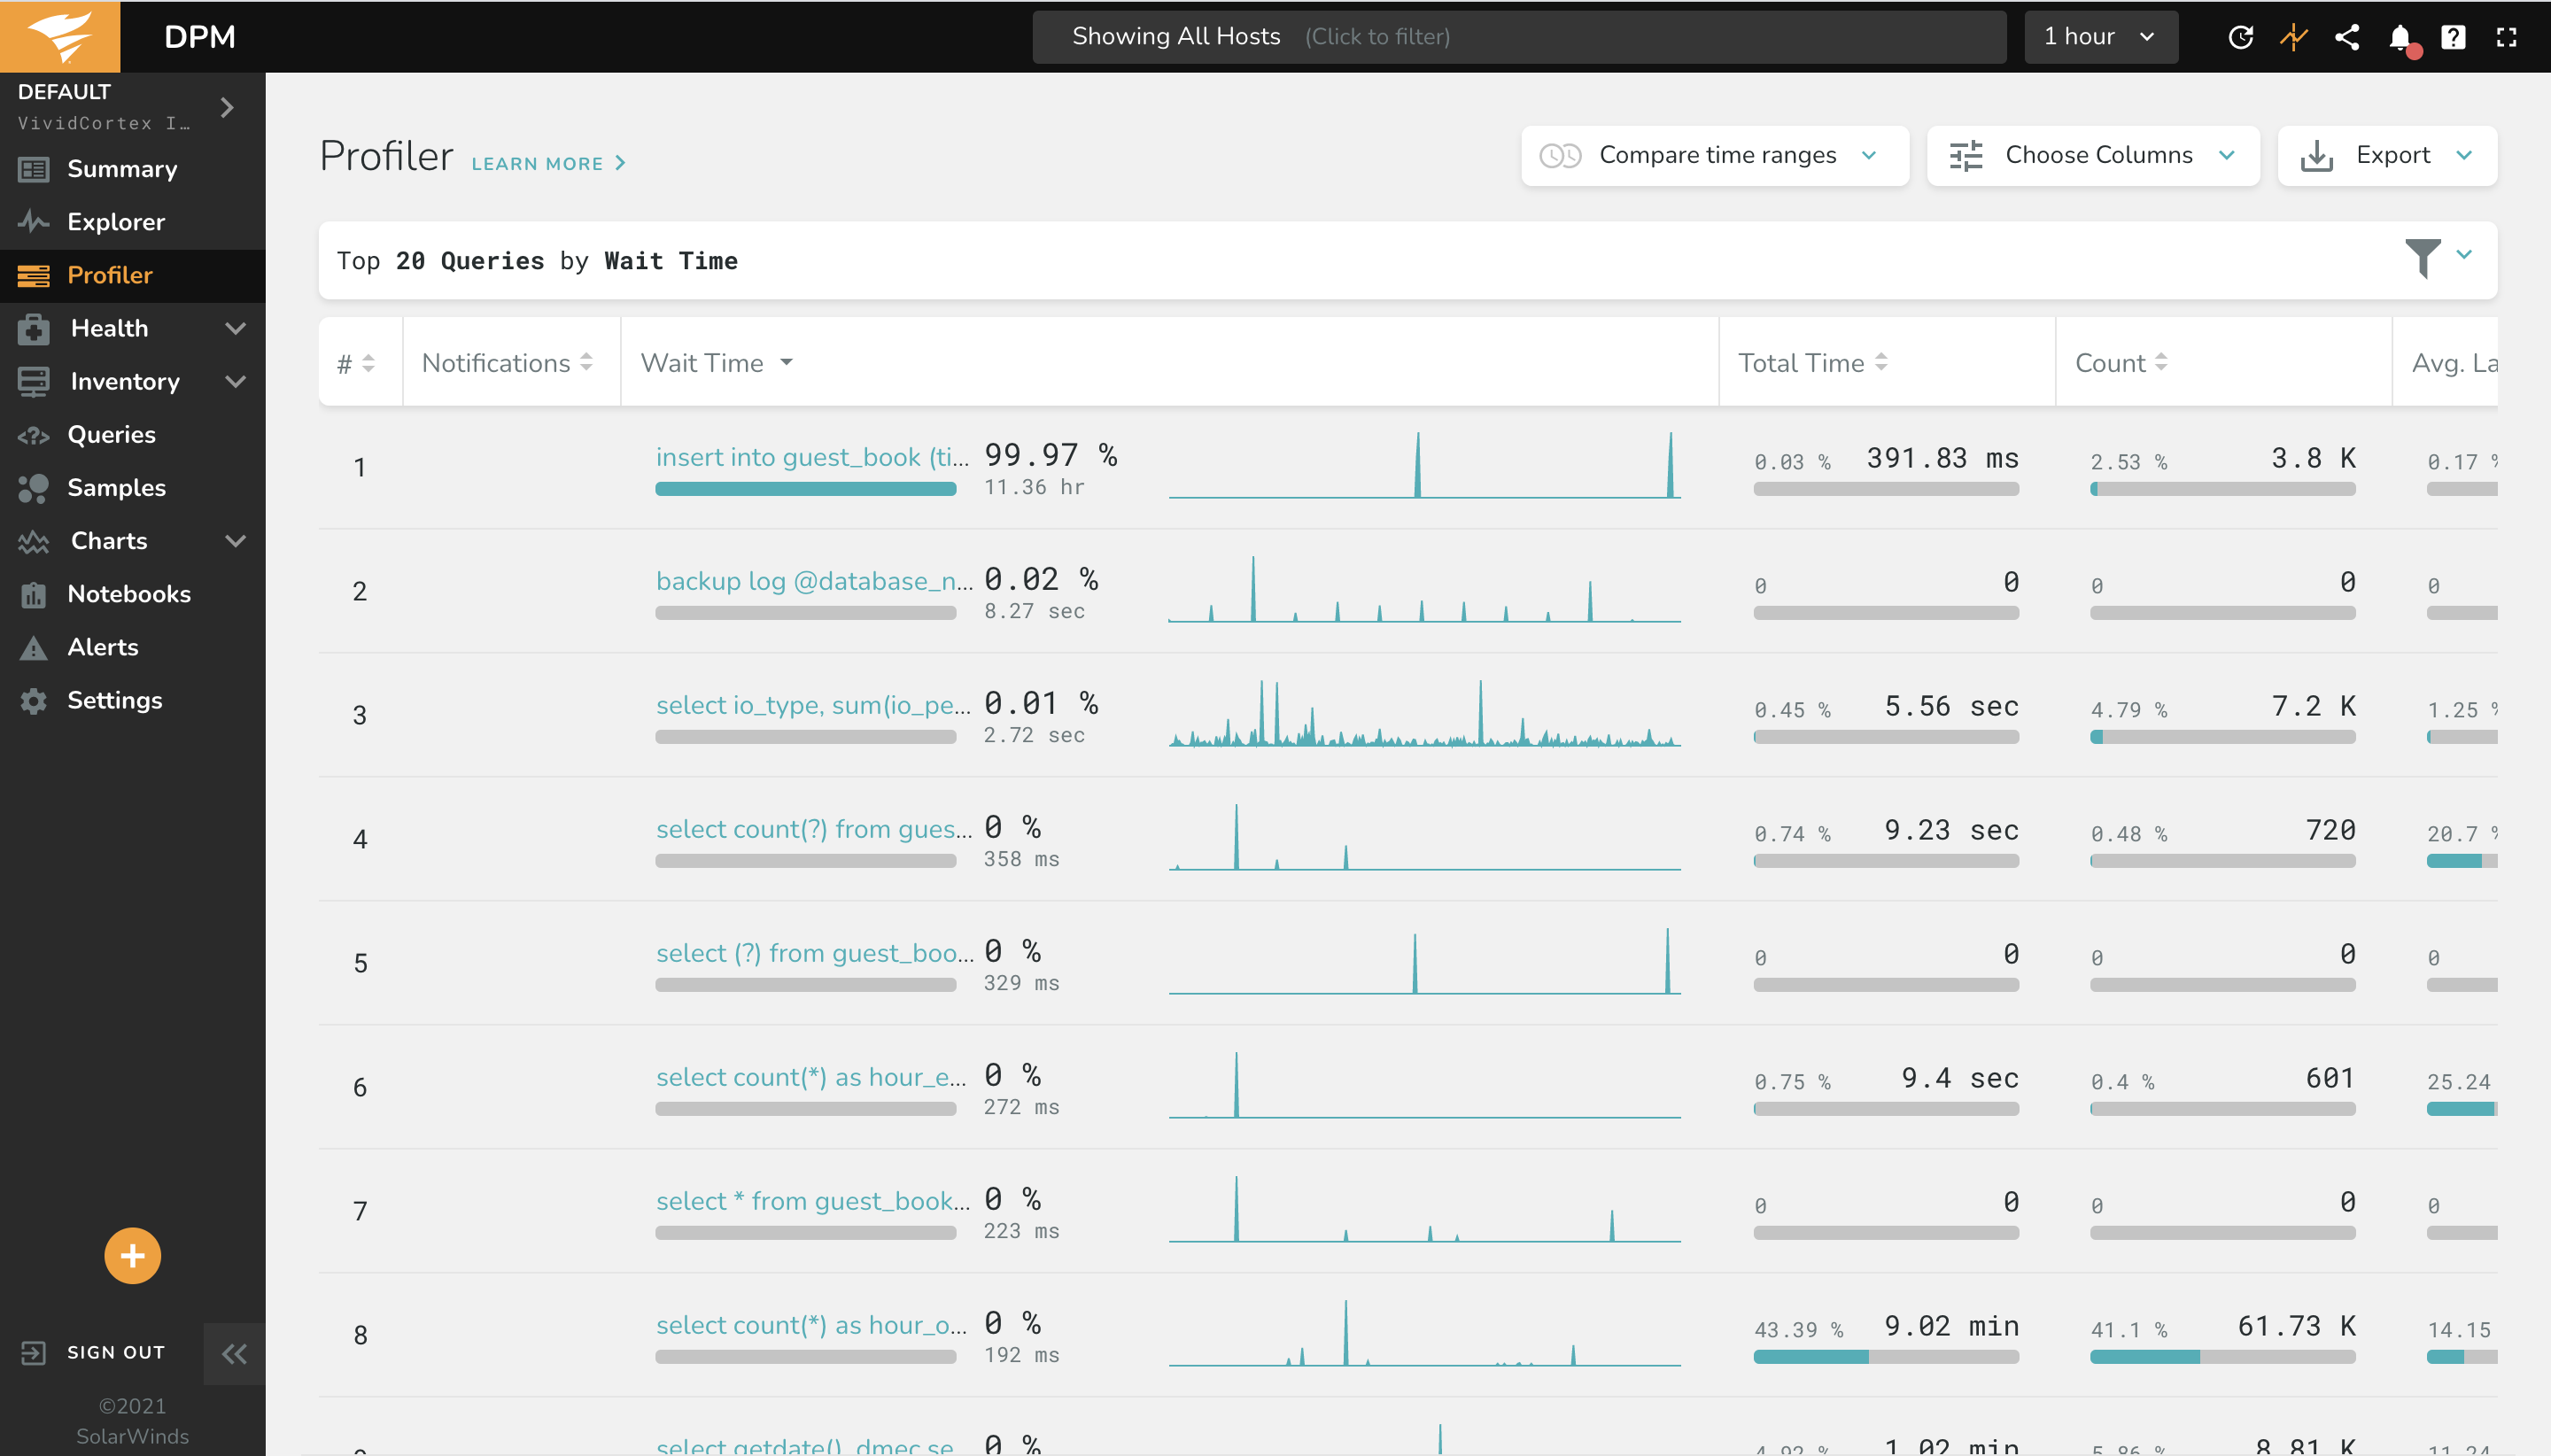
For SQL Server databases, Wait Time data is available in the Profiler and Explorer as its own column of data for applicable queries. Using the host filter at the top of the screen, add the filter “type=mssql” to show only SQL Server databases to quickly find relevant queries. You can also rank Queries in the Profiler and Explorer by Wait Time; in the following example, the top 20 queries ranked by Wait Time are shown:
Category & Ranking Options
Here are all of the categories that can be shown and ranked by the Profiler. Some of these may not be available, depending on your database technology and installation type:
| Category | Description | Can be ranked by… |
|---|---|---|
| Databases | Query and size data grouped by database name | Many metrics, including: Affected Rows, Errors, Data Size, Slow Queries, Warnings, etc. |
| Hosts | Query data grouped by IP address of client | Affected Rows, Count, Errors, Missing Indexes, Slow Queries, Total Time, Warnings |
| InnoDB Mutexes | Requests, and total time waiting, for each InnoDB mutex event name. Requires instrumentation | Count, Wait Time |
| Network Socket Ports | Count of connections on each port | Count |
| Network Socket States | Count of sockets in a given connection state | Count |
| Processes | Metrics about processes running on the OS host | Bytes Read/Written, Sys Calls Read/Write, CPU, etc. |
| Queries | Query digest data captured from either TCP traffic or the MySQL/PostgreSQL query digest summary table | Many metrics, including: Affected Rows, Count, Errors, Failed Rules, Missing Indexes, P99 Latency (On-Host only), Poor Indexes, Slow, Total Time, etc. Clicking on a query in the profiler will display the query details page, which includes key performance metrics, all notifications, and sample executions that have been captured. You can select the option to “Hide VividCortex Queries” which will hide rows containing queries DPM has executed as part of its monitoring. |
| Query Verbs | Query data grouped by query verb, such as SELECT or INSERT |
Affected Rows, Count, Errors, Missing Indexes, Slow Queries, Total Time, Warnings |
| Query Tags | Query data grouped by query tag=value combination. See the query tags documentation for more details on using tags. | Affected Rows, Count, Errors, Missing Indexes, Slow Queries, Total Time, Warnings |
| MongoDB Current Op | MongoDB’s operation states, from the currentOp command |
Blocked, Count, Total Time |
| MongoDB Current Op Callers | Data for IP addresses of database clients, from the currentOp command |
Blocked, Count, Total Time |
| MongoDB Current Op Queries | Queries captured from the currentOp command |
Blocked, Count, Total Time |
| MongoDB Locks | Lock utilization information, from db.serverStatus() |
Acquire Count, Acquire Wait Count, Deadlock Count, Time Acquiring |
| MySQL Processlist Callers | Total connection count and time for client IP addresses, from the MySQL PROCESSLIST |
Count, Total Time |
| MySQL Processlist Commands | Total thread command count and time, from the PROCESSLIST |
Count, Total Time |
| MySQL Processlist Queries | Query digest data captured from the PROCESSLIST |
Count, Locked, Locks, Total Time. “Locked” shows queries that could not execute because they were waiting for a lock; the metric measures the number of instances of the query per second that are waiting. “Locks” shows queries that stopped other queries from executing, by holding a lock; the metric is the number of queries blocked by the shown query. |
| MySQL Processlist States | Thread states from the PROCESSLIST |
Total Time, Count |
| MySQL Processlist Users | Connection data grouped by username, from the PROCESSLIST |
Total Time, Count |
| PostgreSQL Activity | Query digest data captured from pg_stat_activity |
Count, Locked, Locks, Total Time. “Locked” shows queries that could not execute because they were waiting for a lock; the metric measures the number of instances of the query per second that are waiting. “Locks” shows queries that stopped other queries from executing, by holding a lock; the metric is the number of queries blocked by the shown query. |
| PostgreSQL Activity Users | Connection data grouped by username, from pg_stat_activity |
Count, Total Time |
| PostgreSQL Locks | Data grouped by locktype from PostgreSQL’s pg.locks view |
Count, Wait Time |
| Tables / Collections | Table size statistics | Data Free, Data Size, Index Size, Row Count, Total Size |
| Users | Query data grouped by database username | Affected Rows, Count, Errors, Missing Indexes, Slow Queries, Total Time, Warnings |