App Integrations
SolarWinds Database Performance Monitor integrates directly with Slack and Grafana, allowing you to view any chart or metric outside of our web application.
SolarWinds DPM Slack App
SolarWinds DPM Slack App allows you to access database performance data within Slack, using slash commands. This includes the ability to choose the environment, hosts, and time frame, as well as set persistent options (context) to be used repeatedly with your slash commands.
To get started, find the SolarWinds DPM Slack App in the Slack App Directory (yourworkspace.slack.com/apps). Select Add to Slack. Install and authorize access.
Alternatively just click
![]()
to start installation immediately.
When completed you will see a success screen - the app is now ready to be used in any channel, and by any user, within your Slack team/workspace that you authorized.
Use
Once you have installed the App, try this command:
/swidpm chart os-cpu-utilization
You should see a chart of CPU utilization for all of your hosts in one of your environments. (If not, you’ll need to specify an environment; skip to the “Options” section, below.)
Now try the same thing, but for the past day:
/swidpm using time from 1 day ago chart os-cpu-utilization
Let’s look at all of the options available. To get help and see a list of possible commands, type /swidpm help.
The slash command has the following format:
/swidpm [using options] chart <chart-or-metric-name>
Options
The options are:
environment: Which environment to fetch data for. This is the environment’s unique name. Remember that spaces are not allowed in environment names. You can fetch a list of available environments with/swidpm environments.[time] from: The beginning of the timeframe to fetch data. Thetimekeyword is optional. You can use the following formats:/swidpm using time from 2019-08-29 08:00:00 /swidpm using time from August 29, 2019 08:00:00 /swidpm using time from 1 hour/day/week ago
[time] until: The end of the timeframe to fetch data. Thetimekeyword is optional. The formats are the same as withfromwith the additional option ofnow./swidpm using time until now
hosts: A comma- or space-separated list of host names or host IDs./swidpm using hosts db1, db2
Here’s an example of a command which uses every option:
/swidpm using environment production hosts db1,db2 from 2019-08-29 08:00:00 until 2019-08-29 08:15:00 chart os-cpu-utilization
Available Charts
Charts are identified by their IDs. This may be slightly different than their default display title in our web application, but it’s the same ID you use when you edit a Dashboard. You can view a list of available charts with a slash command:
/swidpm [using limit n skip m] charts [<term(s)>]
Here are two examples:
/swidpm charts
/swidpm using limit 30 skip 15 charts mysql
The first example lists the first 15 charts available. The second will list 30, skipping the first 15, and only those matching mysql. You can filter using more than one word, such as:
/swidpm charts mysql threads
The filter will match both the chart title and chart ID. When using a filter with multiple words (mysql threads), the title or ID must match all of the words (they are treated as AND).
A list of chart IDs and their descriptions can also be found in our documentation.
Available Hosts
Hosts are identified by their full names. To fetch a list of host names to use, you can use the following command:
/swidpm [using limit n skip m] hosts [<term(s)>]
Here are two examples:
/swidpm hosts
/swidpm using limit 50 skip 10 hosts api
The first example lists the first 15 hosts. The second will list 50, skipping the first 10, and only those with a hostname containing api.
Available Environments
To fetch the list of all available environments within your SolarWinds DPM organization you can use the following command:
/swidpm environments
Persisted Options (Context)
When you don’t specify a value for one of the options (like in our first example without environment, hosts, or time) it uses the value out of the current context. If you never set the context the App would use the default one. You can see the current context with:
/swidpm set
You can set aspects of your context so that you can run commands over and over without having to type the same option values again. To change the context, use set instead of using, and don’t provide a chart name:
/swidpm set from 1 day ago until now
This will update your context and tell you the new context. Now when you run a command without from or until, it will use the updated context.
One thing to note about now: it sets the time to the current time, and will use that time over and over, so you can see a consistent view of data. It does not update the context as time passes.
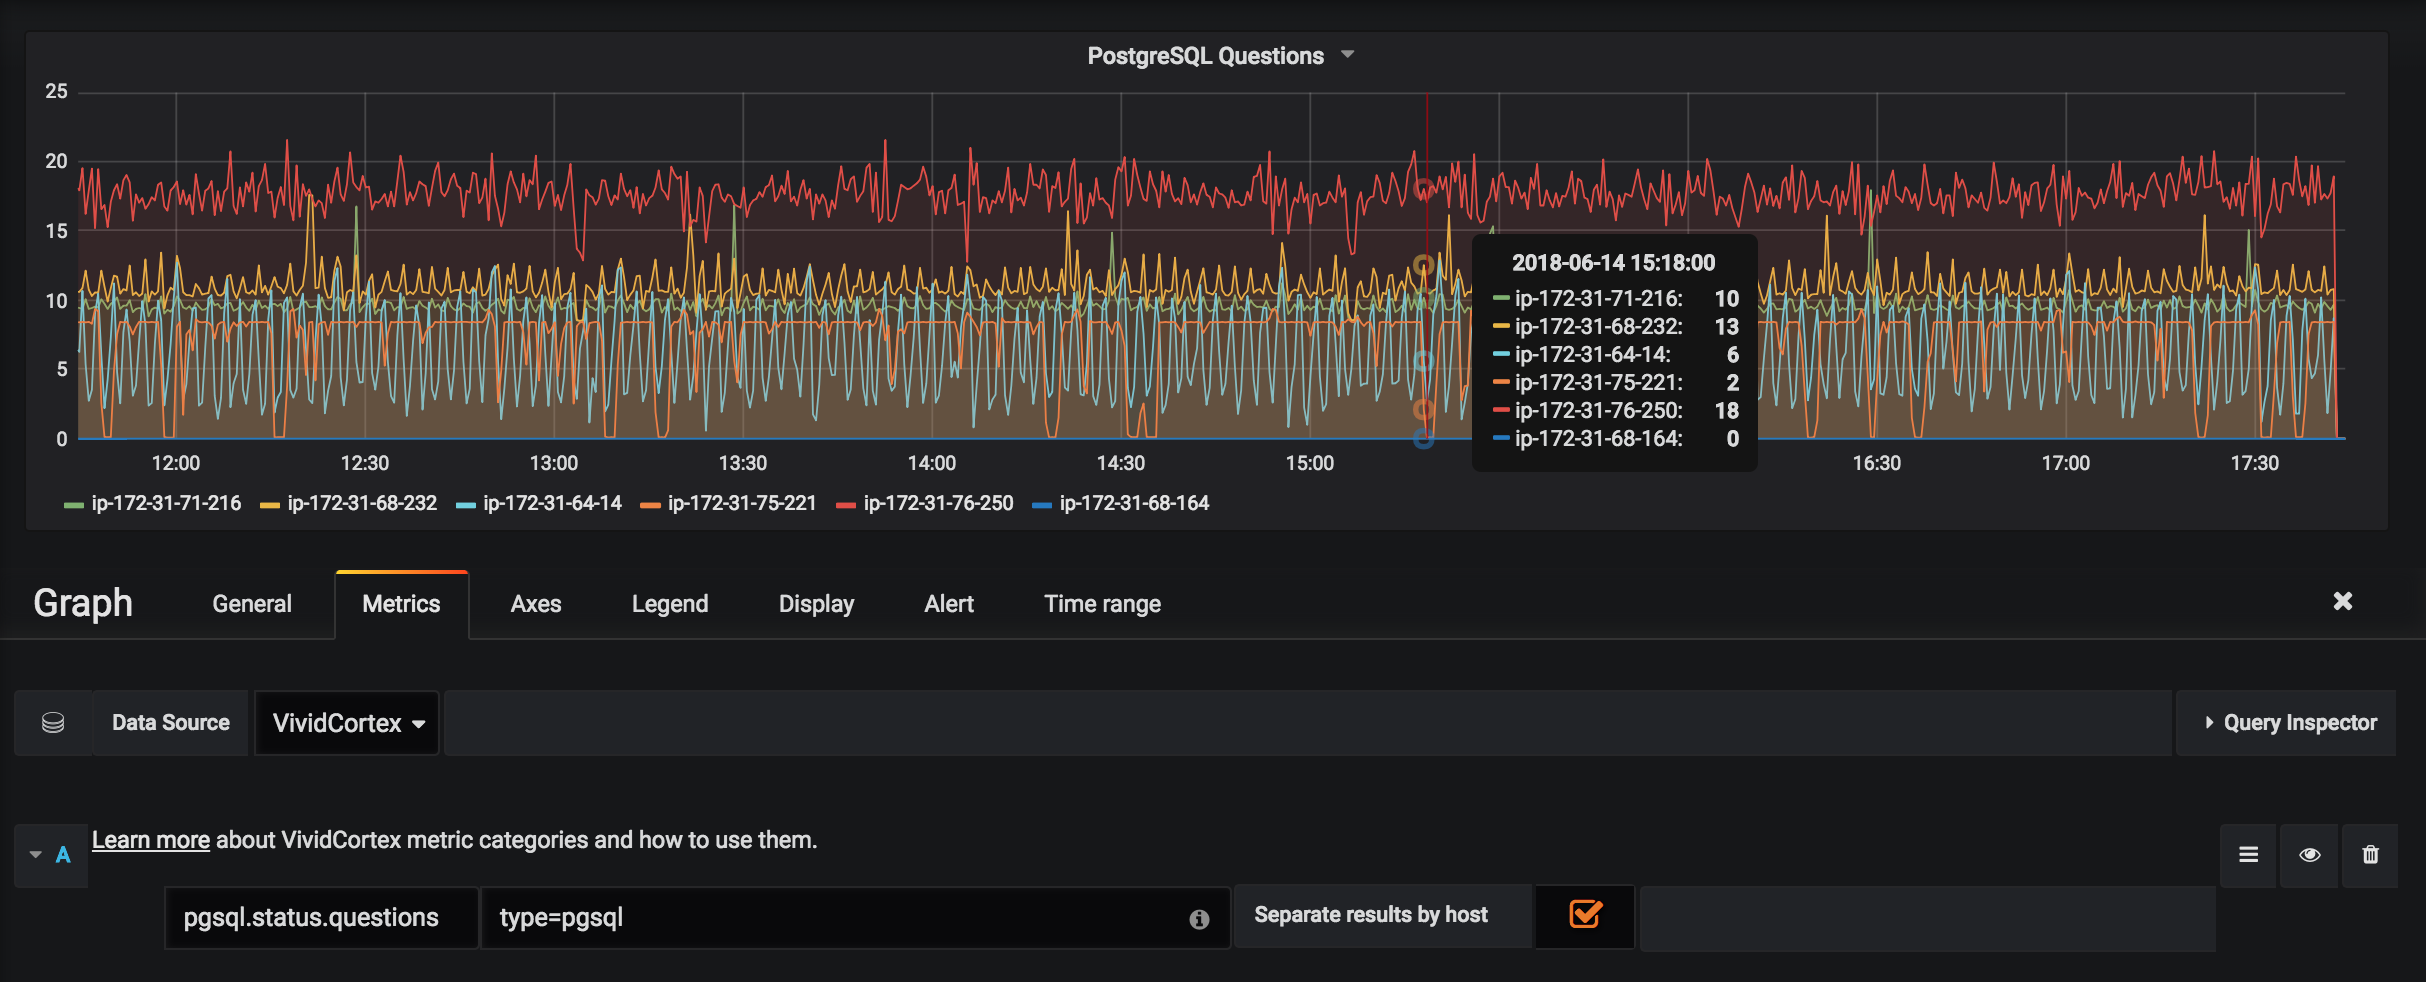
Grafana
SolarWinds DPM integrates directly with Grafana through our Grafana plugin. This allows you to view any of the thousands of metrics SolarWinds DPM collects in a dashboard you and your team are already using. For more information and to get started, check out our Grafana plugin GitHub repo.