Off-Host Installation
In off-host monitoring, the agent is installed on any compatible host, and connects to the monitored server over the network. Use this installation method if:
- You are monitoring Amazon RDS or Aurora for PostgreSQL or MySQL
- You are monitoring Google Cloud SQL (MySQL or Postgres 11+)
- You are monitoring Azure Database for PostgreSQL (version 10+)
- You are monitoring Azure SQL, SQL Server, or RDS SQL Server
- You are monitoring MongoDB Atlas or a MongoDB database with encrypted connections
- You are monitoring DocumentDB in AWS
- You otherwise do not have direct access to the server running the database
- You use encrypted connections or connect to your database using sockets
You can also jump to:
Installing DPM
Open the installation wizard by clicking “Setup your first host” or “Add New Host.” Select “Off-Host” and then your database type.
The installation wizard walks you through steps specifically for the kind of service you want to monitor. The steps are unique for each service; in general you need to enter the address of the service you wish to monitor, as well as the credentials for DPM to use to connect. You then need to install an agent on a separate host to serve as the off-host monitor.
For all database types, follow the steps in the installation wizard to get up and running. The available options for off-host installation are Azure SQL Server, MongoDB, MySQL, PostgreSQL, RDS SQL Server, SQL Server, and Vitess. For MySQL and PostgreSQL, detailed steps are shown in the walkthroughs below:
PostgreSQL
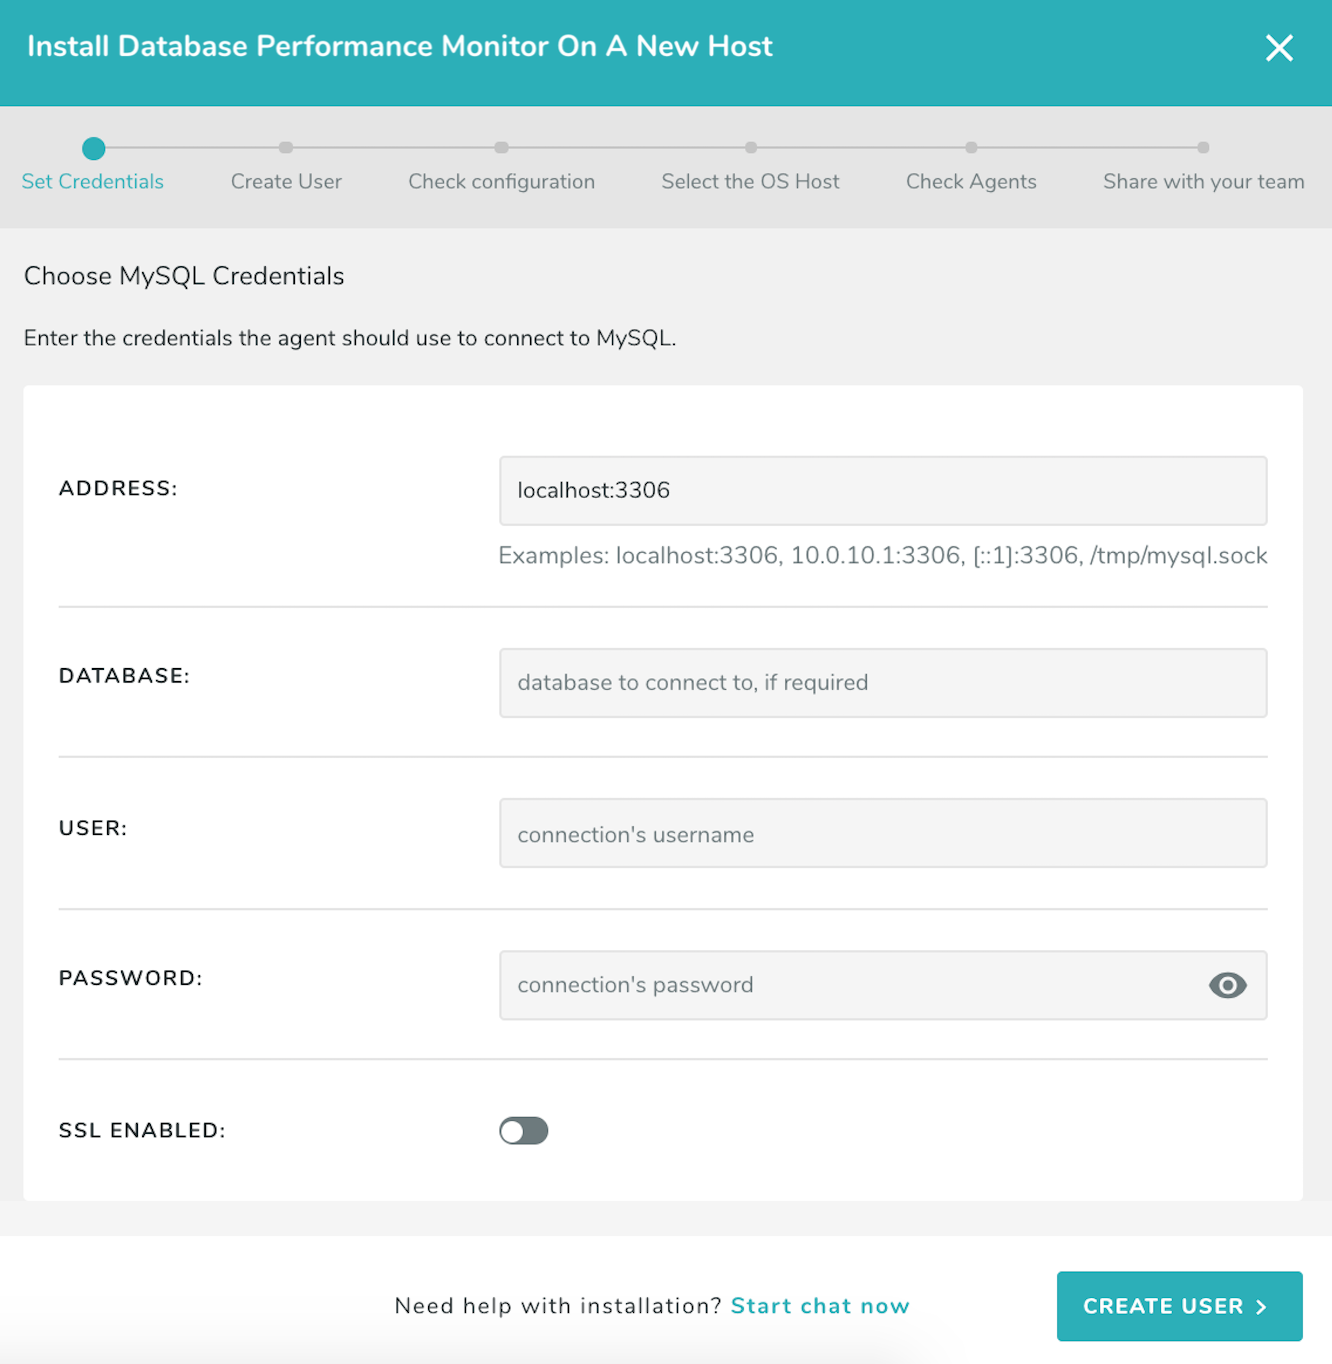
Open the installation wizard and enter the connection information you will use to connect to the database.
For all versions of PostgreSQL query performance statistics are captured from the pg_stat_statements extension. The extension must be enabled (see instructions on how to enable it below).
The monitoring user must have the SUPERUSER, rds_superuser, or pg_monitor role. For PostgreSQL versions without the pg_monitor role, you can also set up monitoring without SUPERUSER.
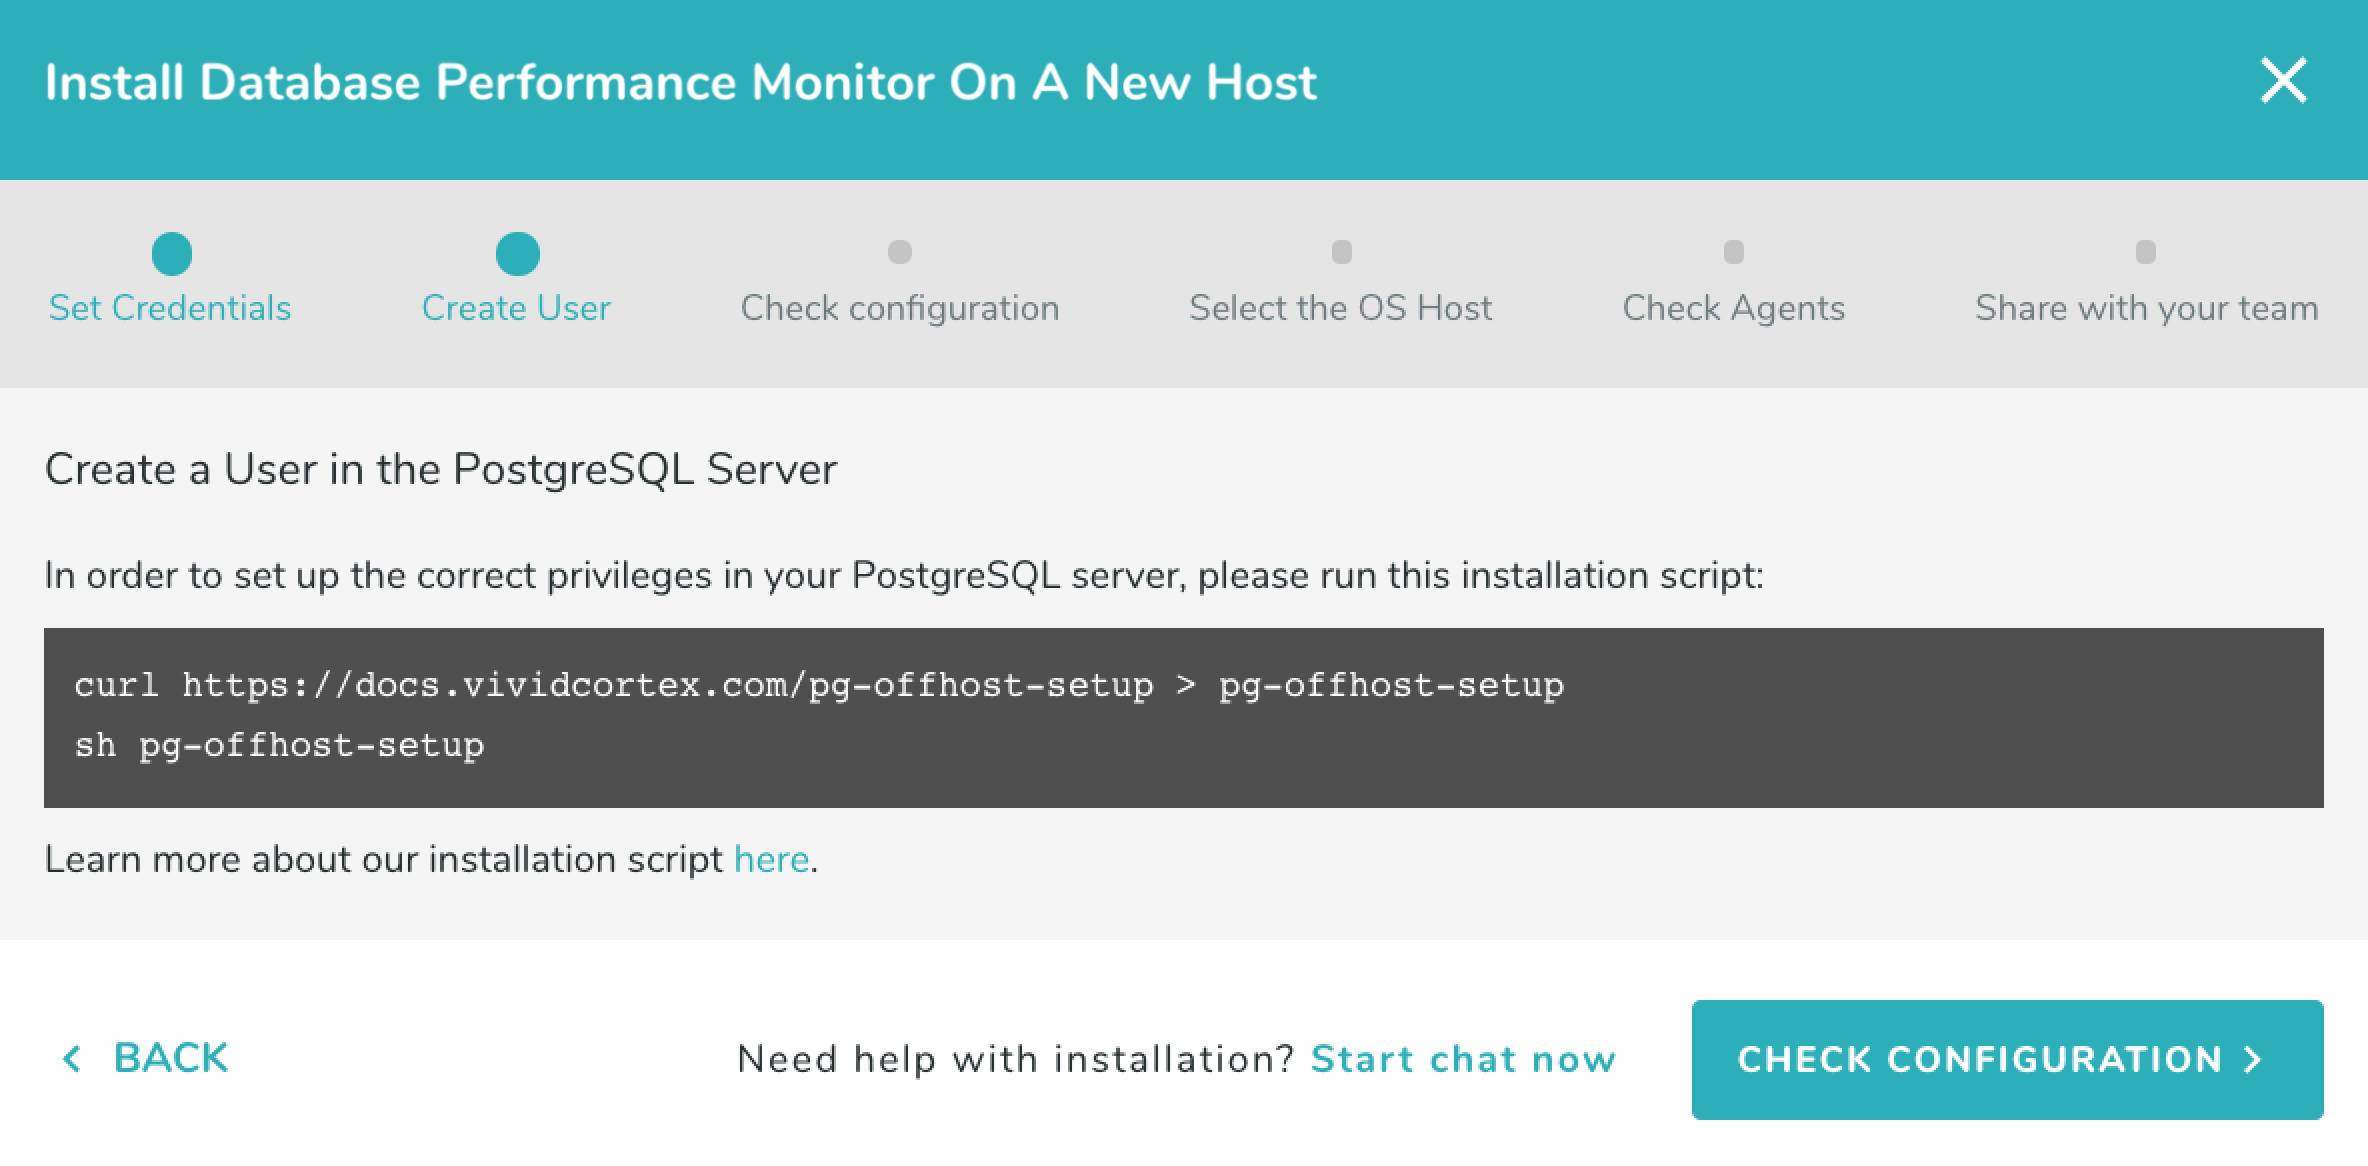
We have created a script which will set up your database for monitoring if you do not already have pg_stat_statements enabled and a monitoring user created; we recommend you use it in this step when prompted by the installation wizard. For more details about this script and its usage, see the “Scripted PostgreSQL Installation” section in the Privileges documentation.
Once the requirements are covered click on “Check configuration.” Run the statement shown by the wizard as the DPM user to check that pg_stat_statements has been enabled and is accessible:
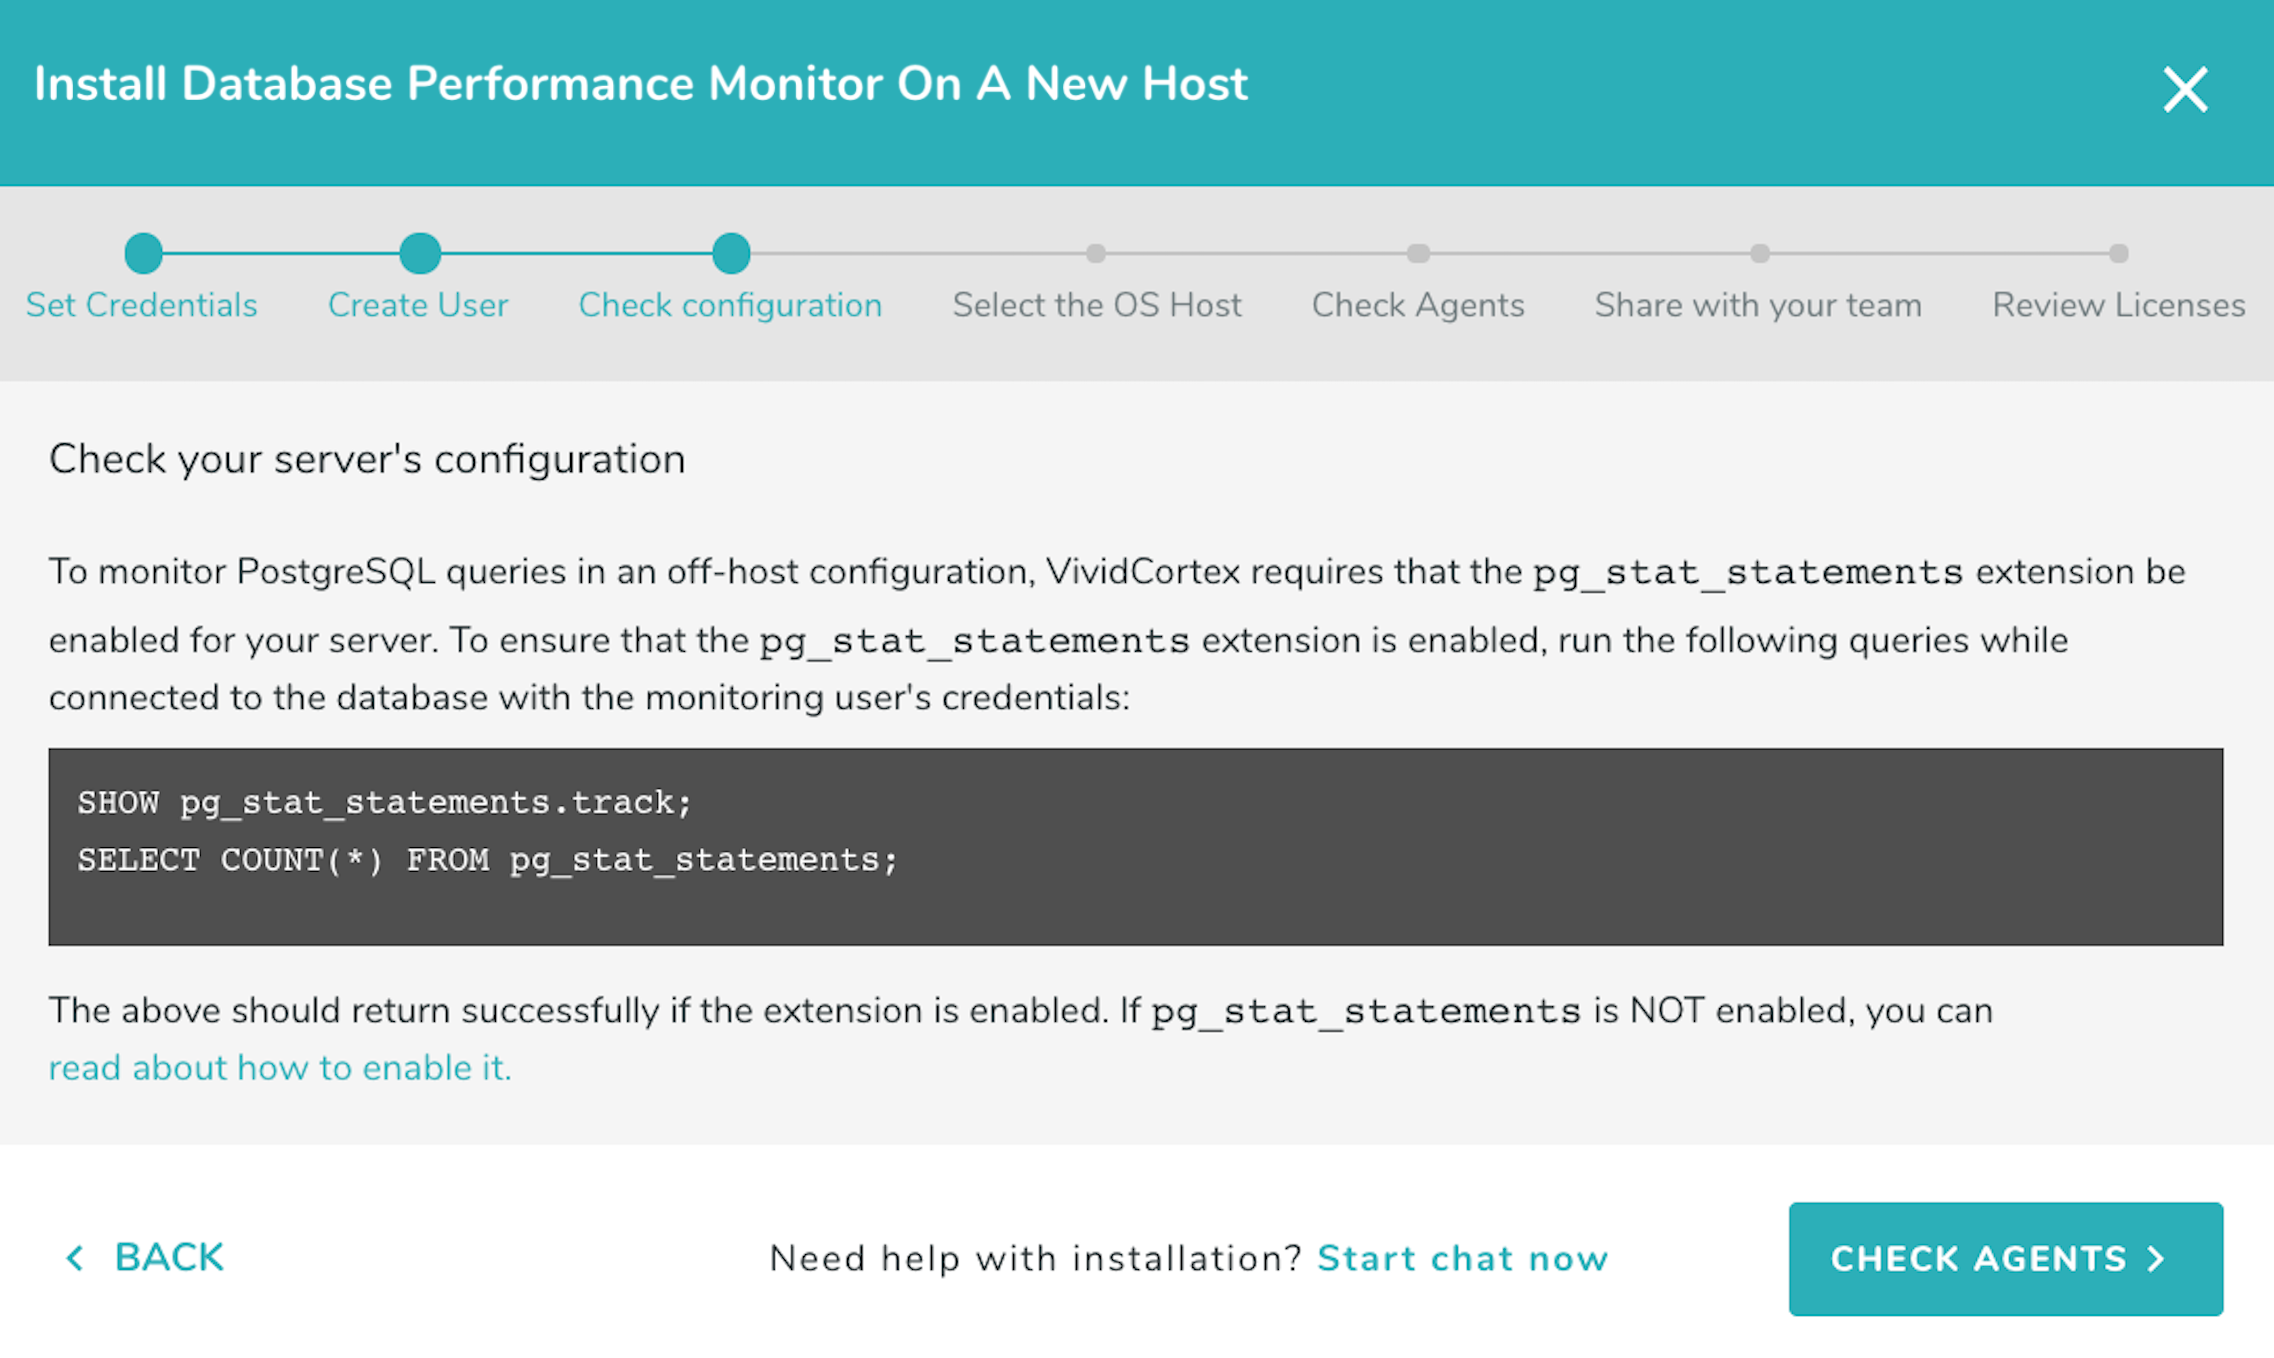
If you have enabled pg_stat_statements but DPM says it is not available, or the DPM user cannot access it, check this FAQ.
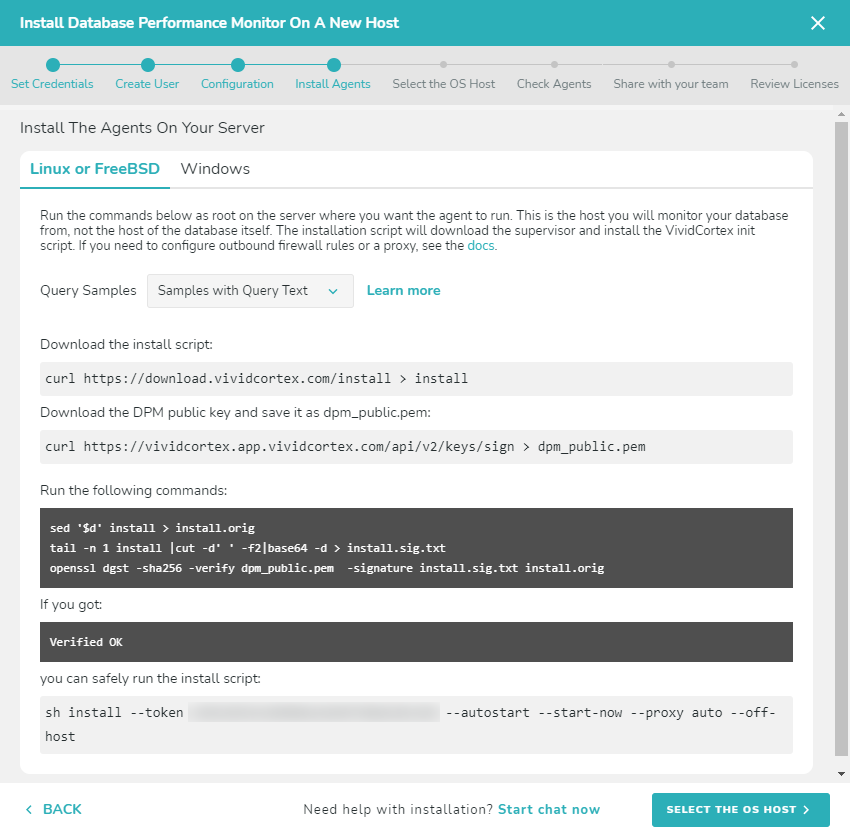
The next step is downloading and installing the agent. The agent monitors the database remotely, running on a different host of your choosing. To download and install the agent, choose the type of operating system your host server is using: Linux or FreeBSD, or Windows. Follow the instructions to install the agent.
Linux or FreeBSD
Run the commands to download and install the agent, which will then detect the databases that can be monitored. Run the installation script on the host where the agent will run (not the host it will monitor), and select that host when it appears in the wizard. Note that you will NOT see the host which you are going to monitor, only the host where the agent will run.
Note: To install the agent to run with a non-root user’s permissions, add the –user parameter when running the install script. You still need to run the install script as root. Example:
sudo sh install --token [your token] --autostart --start-now --proxy auto --user [username]
Windows
Follow the onscreen instructions to download and install the agent using the SolarWinds DPM installer. The installer must be run as an Administrator.

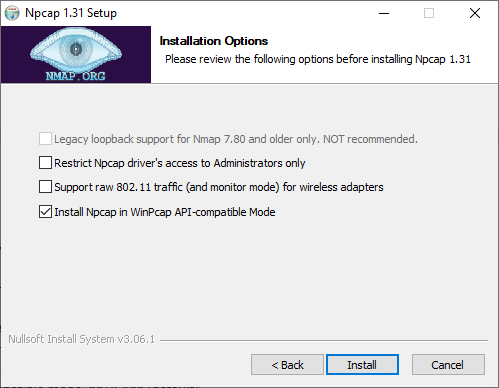
Important: If you don’t have a packet capture driver in place, the SolarWinds DPM Windows agent installer will ask you to install one if you intend to do on-host monitoring. We recommend downloading and installing Npcap. Make sure to use following configuration:
- Automatically start the Npcap driver at boot time TICK
- Support loopback traffic (“Npcap Loopback Adapter” wll be created) TICK
- Use DLT_NULL as the loopback interface link layer protocol instead of DLT_EN10MB TICK (default)
- Restrict Npcap driver’s access to Administrators only TICK
- Support raw 802.11 traffic (and monitor mode) for wireless adaptors UNTICK
- Support 802.1Q VLAN tag when capturing and sending data TICK (default)
- Install Npcap in WinPcap API-compatible mode TICK (default)
Follow the onscreen instructions to complete the agent installation.
After installing the agent, return to the SolarWinds DPM app and continue the off-host installation process. Select the host when it appears in the wizard. Note that you will NOT see the host which you are going to monitor, only the host where the agent will run.
To install the agent with the ability to change the monitoring host later, please refer to the Moving Agents to a New Host section.
Once you have selected a host, continue by clicking “Check Agents.”
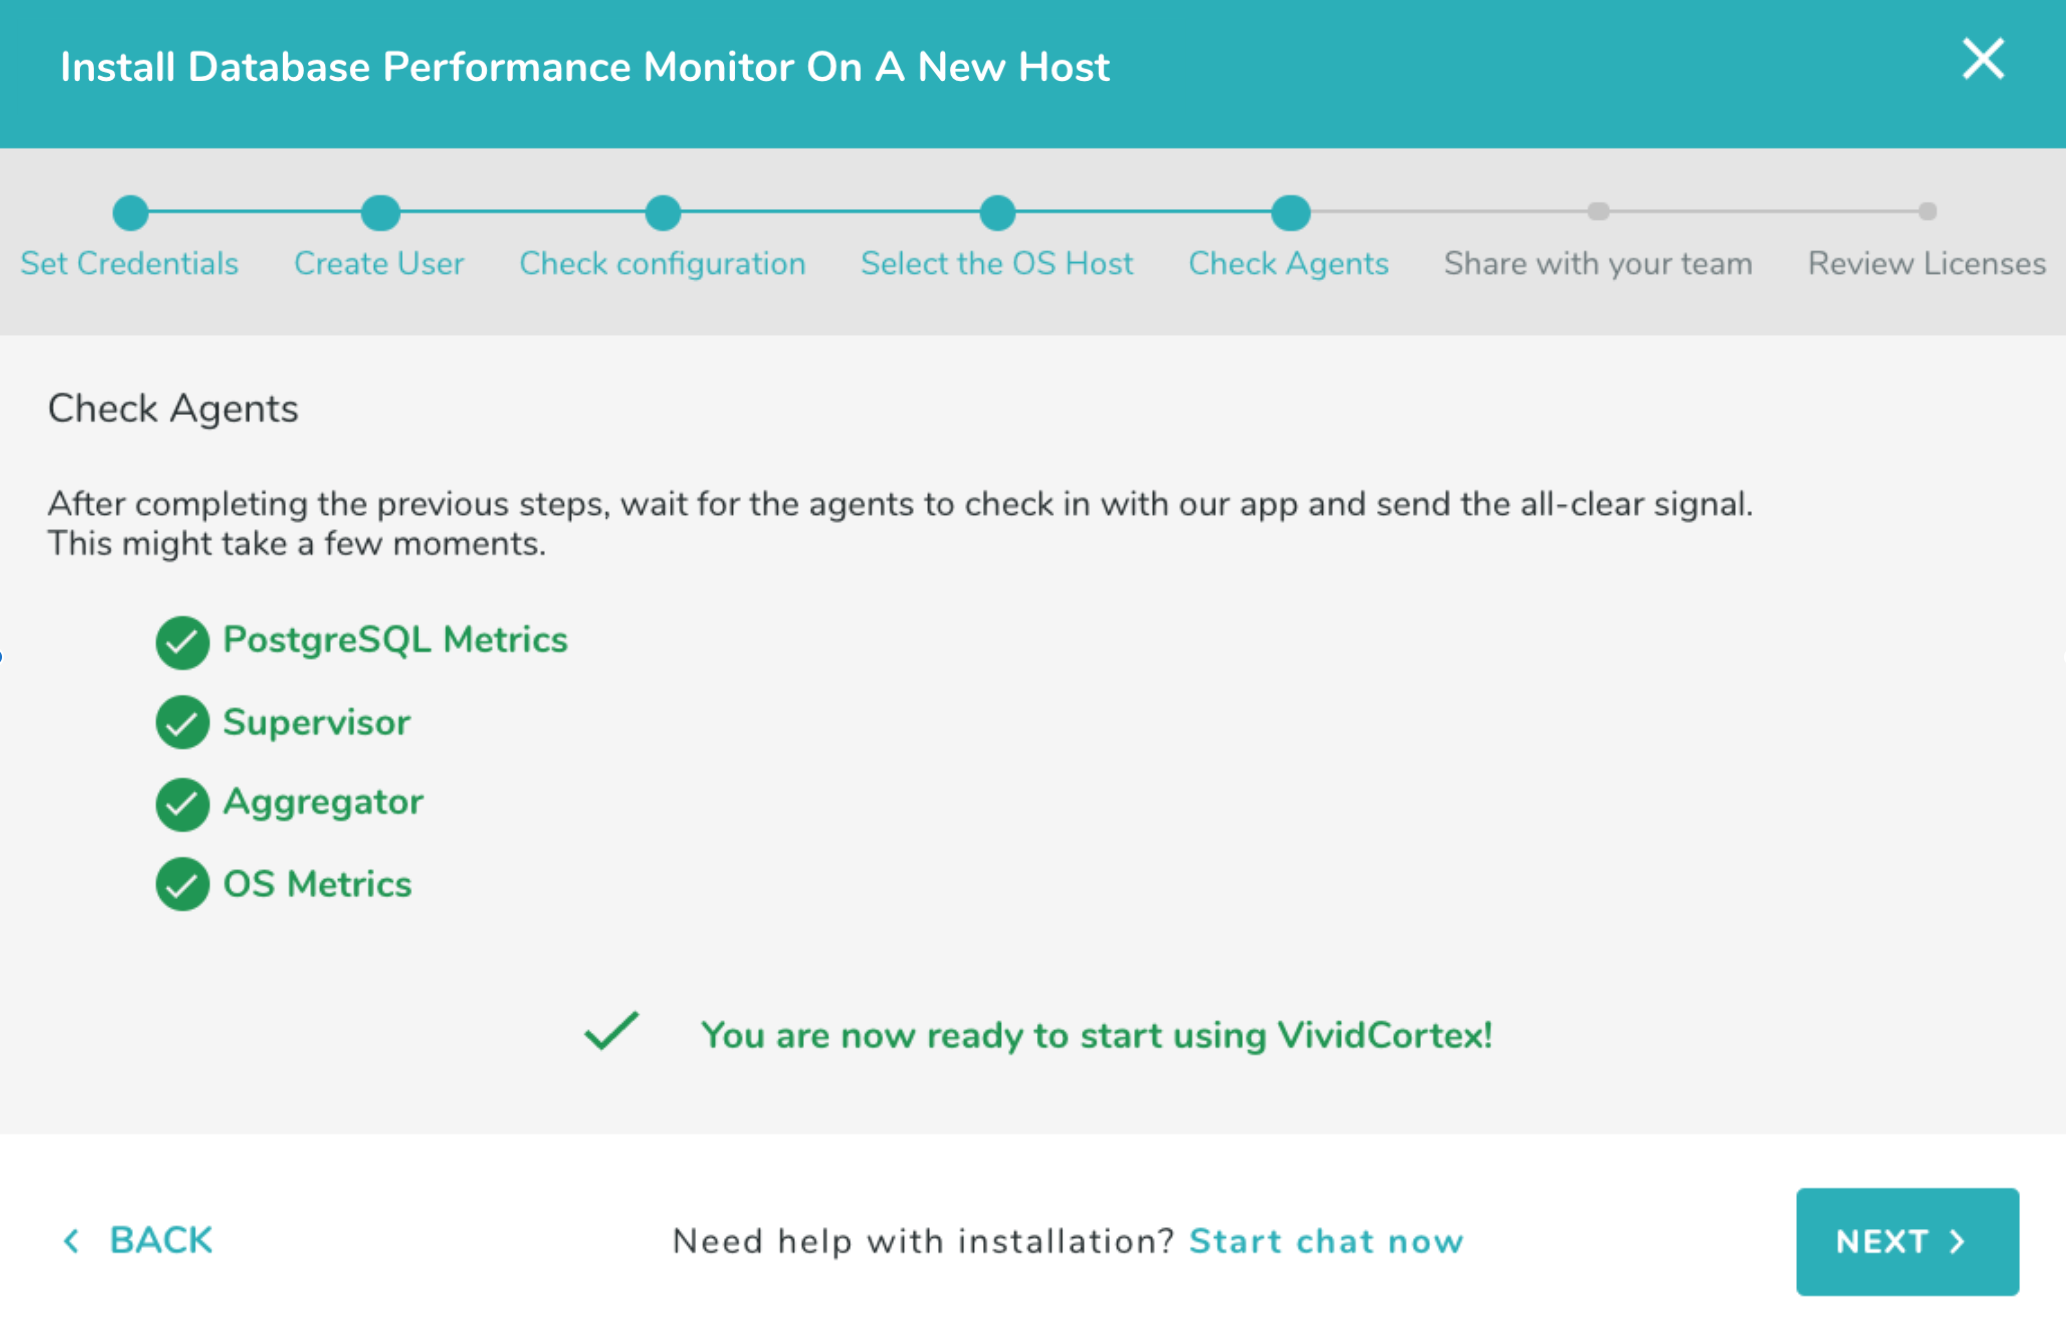
Once the agent has checked-in successfully, you can finish the process by inviting any users who need access to DPM in the last step. If any of the agents fail a check, close the wizard by clicking the ‘x’ in the top-right corner of the wizard and check the relevant agent’s log (either in /var/log/vividcortex/ or through the Inventory -> Agents page) for more details.
Enabling pg_stat_statements on PostgreSQL
You can enable the pg_stat_statements extension on a PostgreSQL server by installing the postgresql-contrib package (if not already present) then adding the following entries to your postgres.conf configuration file:
shared_preload_libraries = pg_stat_statements
track_activity_query_size = 4096
pg_stat_statements.track = ALL
The first line is required to make the extension available in the server, the second configures the database to record up to 4096 bytes of a query, and the third one is used to track statements inside stored procedures.
In the case of an Amazon RDS instance follow these instructions instead:
- Create a new custom DB Parameter Group in the RDS Dashboard, or modify an existing one.
- Set an option for each of the settings discussed above.
- Apply the parameter group.
The last step, in both cases, is to restart the server/instance.
Once this is complete, you can use our scripted installation to create the pg_stat_statements extension and an appropriate user or you can create the extension yourself. To create it yourself, log in and run the statement CREATE EXTENSION pg_stat_statements; on the database you want the monitoring user to connect to. The user assigned to DPM must have access; you can verify this by running
SELECT COUNT(*) FROM pg_stat_statements;
as the user you have created for use with DPM. If this does not return successfully, it is likely that pg_stat_statements does not exist on the database the DPM user is connected to. See this FAQ for more information.
MySQL
Open the installation wizard and enter the connection information you will use to connect to the database. If monitoring an Amazon Aurora cluster use only the instance endpoints and not the cluster endpoints. Make sure you have PERFORMANCE_SCHEMA enabled (see instructions on how to enable it below). If you have not already created a user with the correct privileges for DPM to use, you can do that now. Select “Create User”.

The wizard provides the steps to create a MySQL user with the necessary privileges for the agent to monitor the database. For more information about these privileges and the purpose each of them serves, refer to the MySQL section in our Privileges documentation.
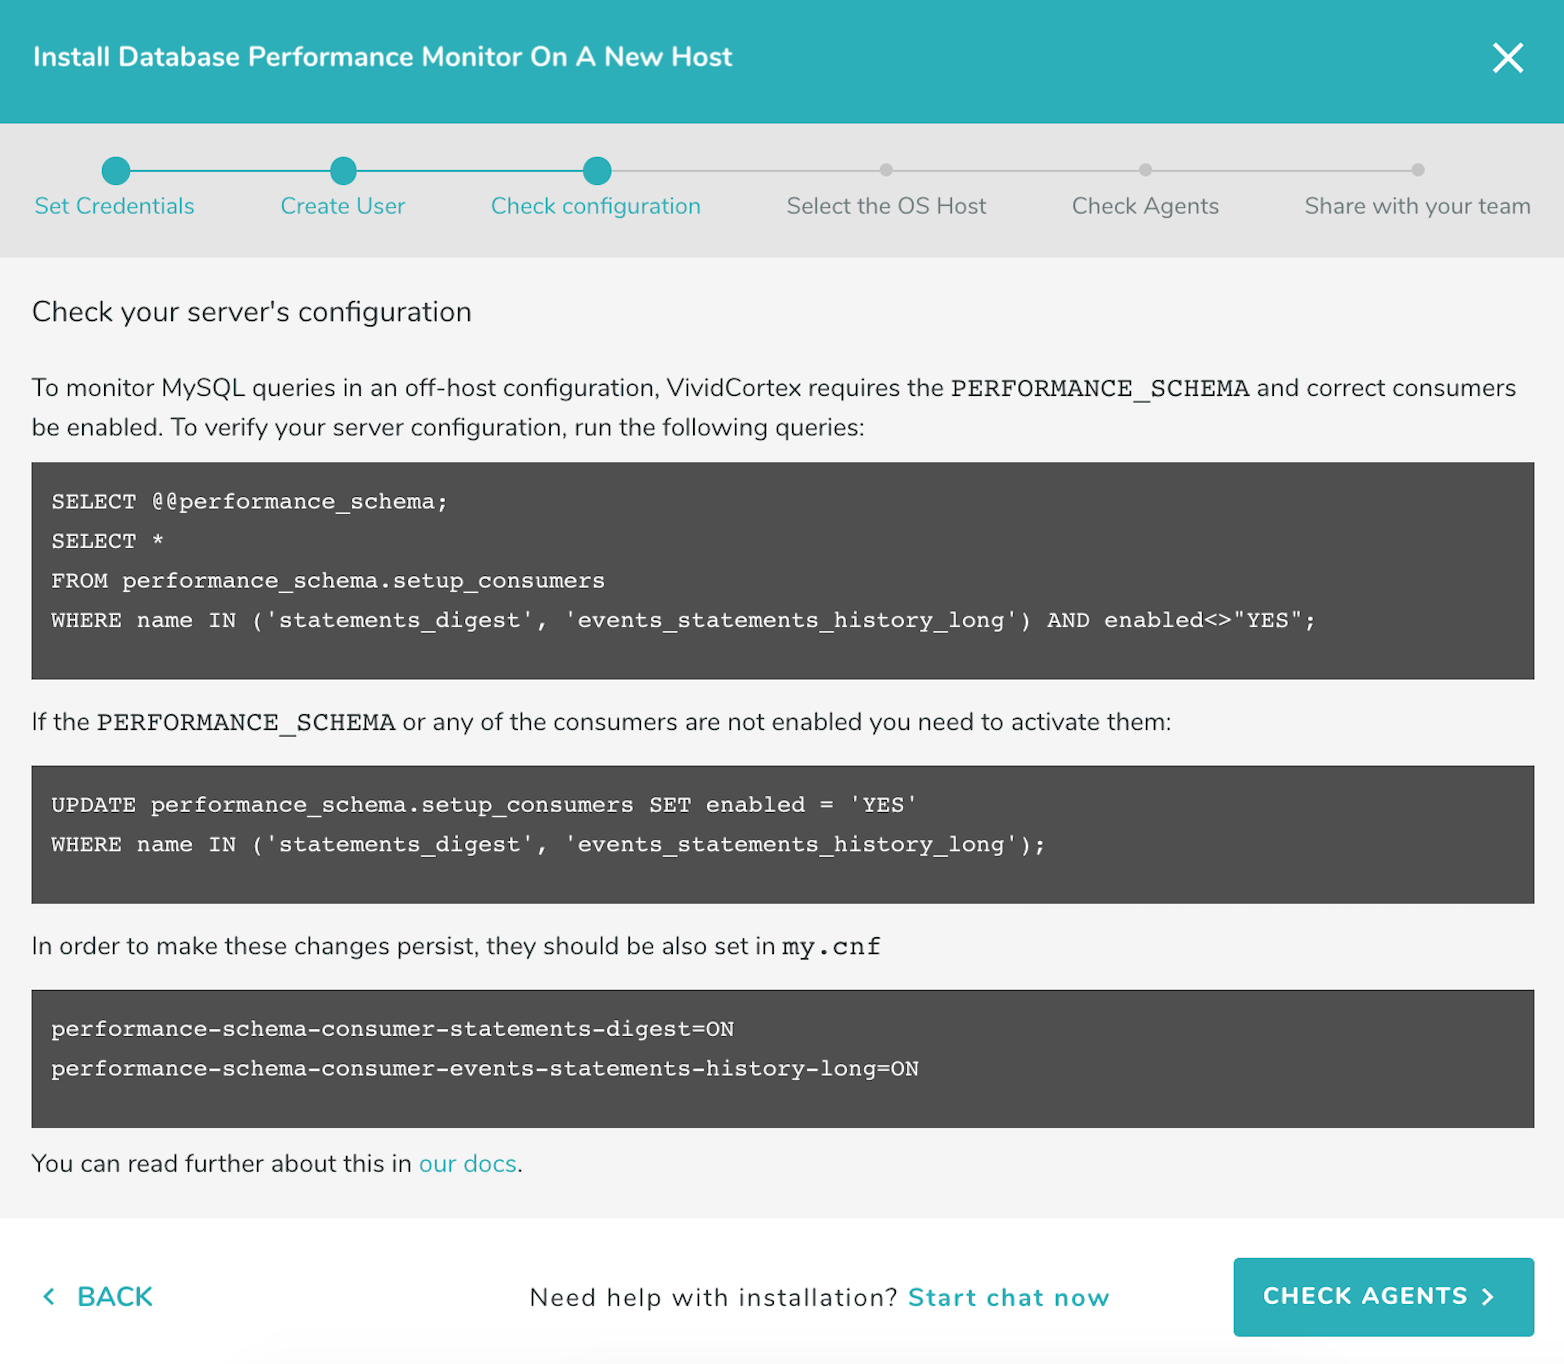
Run the statements shown by the wizard as the DPM user to check that the necessary PERFORMANCE_SCHEMA tables have been enabled and are accessible:
The next step is downloading and installing the agent. The agent monitors the database remotely, running on a different host of your choosing. To download and install the agent, choose the type of operating system your host server is using: Linux or FreeBSD, or Windows. Follow the instructions to install the agent.
Linux or FreeBSD
Run the commands to download and install the agent, which will then detect the databases that can be monitored. Run the installation script on the host where the agent will run (not the host it will monitor), and select that host when it appears in the wizard. Note that you will NOT see the host which you are going to monitor, only the host where the agent will run.
Note: To install the agent to run with a non-root user’s permissions, add the –user parameter when running the install script. You still need to run the install script as root. Example:
sudo sh install --token [your token] --autostart --start-now --proxy auto --user [username]
Windows
Follow the onscreen instructions to download and install the agent using the SolarWinds DPM installer. The installer must be run as an Administrator.
Important: If you don’t have a packet capture driver in place, the SolarWinds DPM Windows agent installer will ask you to install one if you intend to do on-host monitoring. We recommend downloading and installing Npcap. Make sure to use following configuration:
- Automatically start the Npcap driver at boot time TICK
- Support loopback traffic (“Npcap Loopback Adapter” wll be created) TICK
- Use DLT_NULL as the loopback interface link layer protocol instead of DLT_EN10MB TICK (default)
- Restrict Npcap driver’s access to Administrators only TICK
- Support raw 802.11 traffic (and monitor mode) for wireless adaptors UNTICK
- Support 802.1Q VLAN tag when capturing and sending data TICK (default)
- Install Npcap in WinPcap API-compatible mode TICK (default)
Follow the onscreen instructions to complete the agent installation.
After installing the agent, return to the SolarWinds DPM app and continue the off-host installation process. Select the host when it appears in the wizard. Note that you will NOT see the host which you are going to monitor, only the host where the agent will run.
To install the agent with the ability to change the monitoring host later, please refer to the Moving Agents to a New Host section.
Once you have selected a host, continue by clicking “Check Agents.”
Once the agent has checked-in successfully, you can finish the process by inviting any users who need access to DPM in the last step. If any of the agents fail a check, close the wizard by clicking the ‘x’ in the top-right corner of the wizard and check the relevant agent’s log (either in /var/log/vividcortex/ or through the Inventory -> Agents page) for more details.
Enabling PERFORMANCE_SCHEMA on MySQL
You can enable the PERFORMANCE_SCHEMA in a self-hosted MySQL server by adding the following line to your my.cnf configuration file under the [mysqld] section:
performance_schema
In the case of an Amazon RDS or Aurora instance follow these instructions instead:
- Create a new custom DB Parameter Group in the RDS Dashboard, or modify an existing one.
- Set option
performance_schema = 1 - Apply the parameter group.
In either case (self-hosted or RDS/Aurora) you’ll need to restart the server/instance for the changes to take effect.
The statements_digest and events_statements_history_long consumers need to be enabled:
UPDATE performance_schema.setup_consumers SET enabled = 'YES' WHERE name in ('statements_digest', 'events_statements_history_long');
Note that if you enable the consumers and restart your server they may no longer be enabled upon restart. To ensure this setting persists, add:
performance-schema-consumer-statements-digest=ON
performance-schema-consumer-events-statements-history-long=ON
to your my.cnf file.
When using Amazon RDS or Aurora this option cannot be set via parameter group and cannot be persisted between restarts. However, the DPM agent can automatically enable these consumers if it detects that they are not enabled. To enable this setting, you can select “Force Off Host Samples” in an Environment’s Query Data Settings page. Alternatively, you can add the following options to your DPM global.conf configuration file and restart your agents:
{
    "force-offhost-digests": "true",
    "force-offhost-samples": "true"
}
The DPM user will need permission to update the performance_schema.setup_consumers table, e.g.:
GRANT UPDATE ON performance_schema.setup_consumers TO vividcortex@'%';
More information about configuration files, including correct JSON formatting, is available here.
MongoDB
DPM can monitor a remote MongoDB database or a local database using encrypted connections. There are two sources of data available, MongoDB’s Database Profiler and the Event Log.
Using the Profiler allows DPM to capture metrics more reliably than the Log for the queries we observe, but there is a
db.Profilecollection that has to be accessed for each logical database on the MongoDB server, which can have a performance impact.The Log has the advantage that it doesn’t matter how many logical databases your MongoDB instance is hosting. However, log-lines are truncated after 1024 characters, so we lose information for anything besides short queries.
Both installation methods are available through the in-app Add New Host wizard. Open the Wizard, choose Off-Host, and select MongoDB. DPM should be configured to monitor one host per shard, with an address such as mongodb://cluster0-shard-00-00-ream0.mongodb.net:27017. DPM supports the mongodb+srv syntax; to install using this syntax, follow the Advanced Installation Instructions for MongoDB. DPM will connect to the first instance returned by DNS.
DocumentDB
DPM can monitor AWS DocumentDB clusters remotely from an EC2 instance in your VPN. Amazon does not provide off-host monitoring solutions for DocumentDB clusters that would normally be available in a Mongo cluster, so we use a combination of Cloudwatch metrics and traffic mirroring sessions to monitor the cluster.
First, set up your monitoring instance.
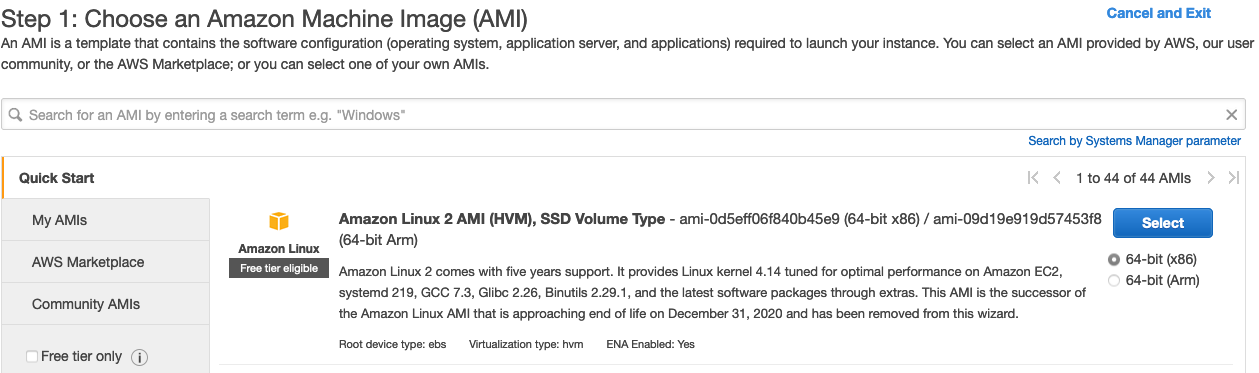
Create an EC2 instance to house the agents that will monitor your DocumentDB cluster. It should be an Amazon Linux instance sized to at least t3.small with the default 8GiB of storage. It should be in a security group that allows it to connect to the VPC with the DocumentDB Cluster. The instance should have networking configuration consistent with our Required Network Settings.
Attach a role to that instance with at least the policies AmazonRDSReadOnlyAccess and CloudWatchReadOnlyAccess
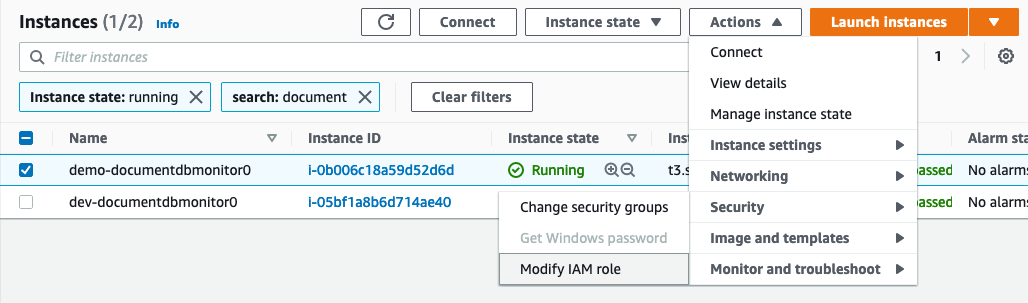
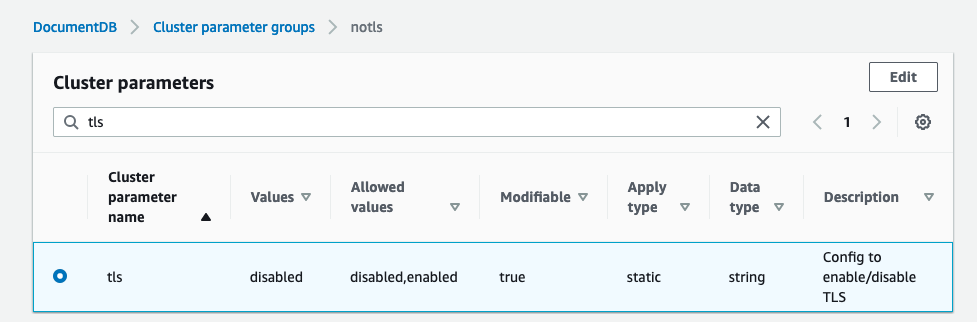
Disable TLS on your DocumentDB cluster using these instructions. This is required for DPM agents to read mirrored traffic on the cluster. TLS cannot be enabled for DocumentDB hosts because DPM agents cannot read encrypted traffic.
Please take care not to expose your DocumentDB cluster to the public internet. This setup would work best with both the DocumentDB cluster and the monitoring EC2 instance in a standard VPN setup.
Now, set up traffic mirroring on the cluster:
- Record the monitoring instance ENI (Elastic Network Interface) for use in the next steps. You can find this in the EC2 dashboard by selecting the monitoring instance, and navigating to the
Network interfacessection under theNetworkingtab

- Select a
VNI (VXLAN network identifier)- an arbitrary number between 0 and 16777215. - Create a traffic mirror target in the VPC dashboard under Traffic Mirroring:
- Destination = ENI from step 1.


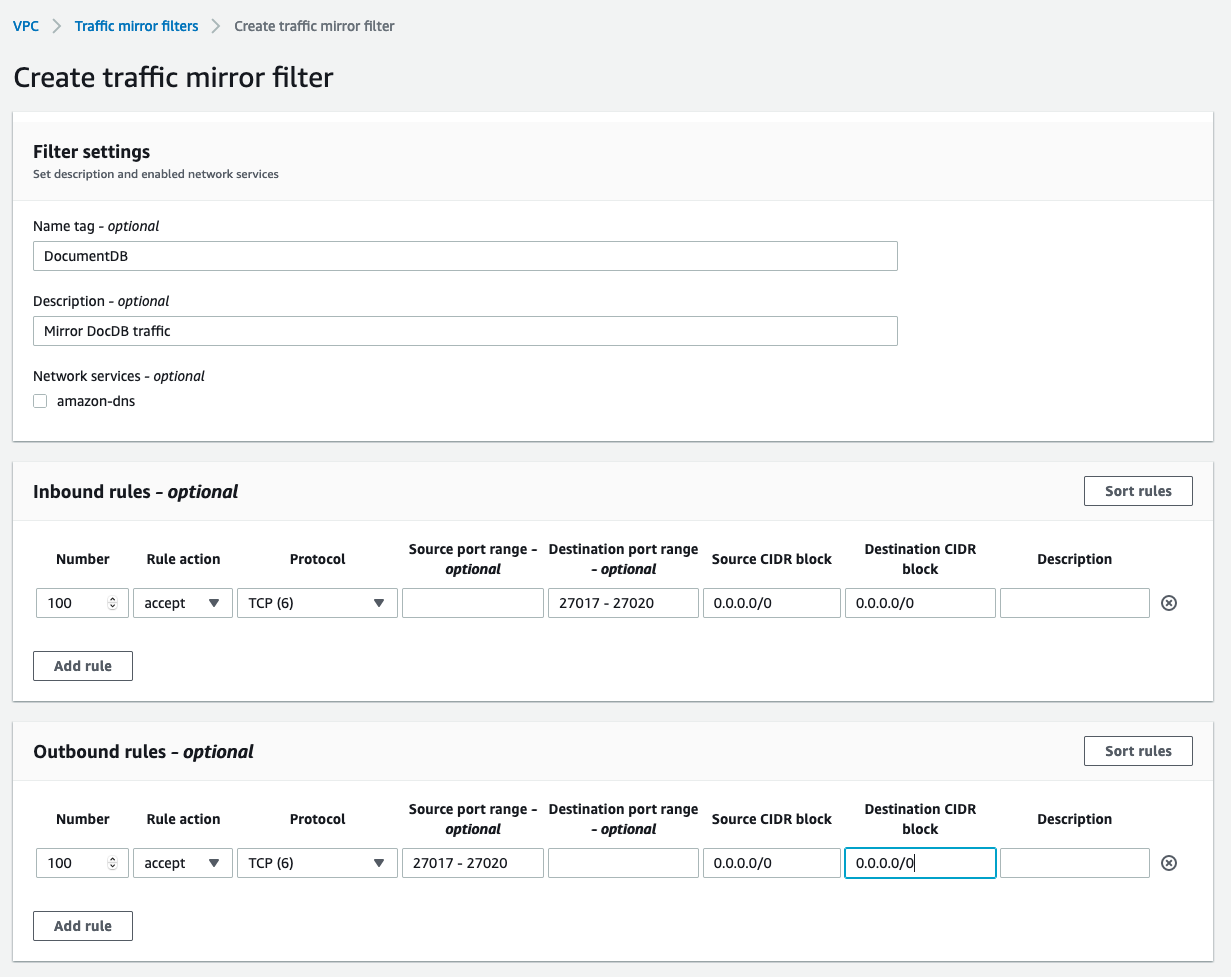
- Create a traffic mirroring filter for DocumentDB in the VPC dashboard under Traffic Mirroring:
- Inbound accept TCP rule
- source CIDR block:
0.0.0.0/0 - destination CIDR block:
0.0.0.0/0 - Destination port range:
27017 - 27020
- source CIDR block:
- Outbound accept TCP rule
- source CIDR block:
0.0.0.0/0 - source port range:
27017 - 27020 - destination CIDR block:
0.0.0.0/0
- source CIDR block:
- Inbound accept TCP rule
SSH into the monitoring instance and set up a VXLAN interface for DPM agents to listen on
ip link add vxlan0 type vxlan id <VNI from step 2> dev eth0 dstport 27017ip link set vxlan0 up
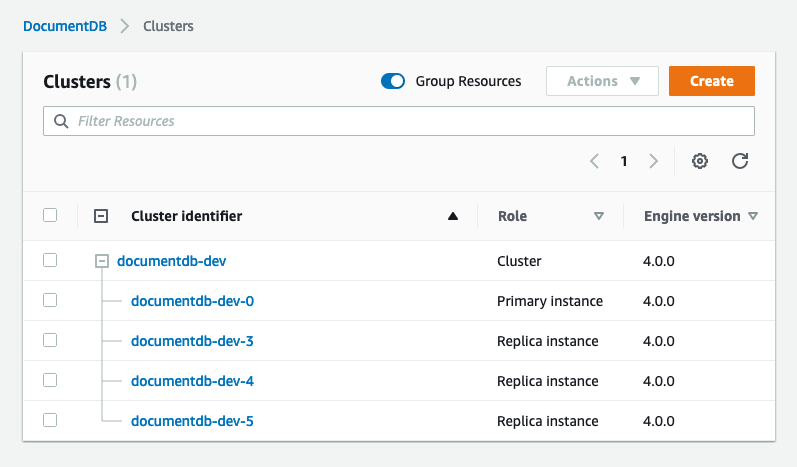
Create traffic mirroring sessions for each node in the DocumentDB cluster. You will need to do this every time you add new replicas to the cluster, for each new replica.
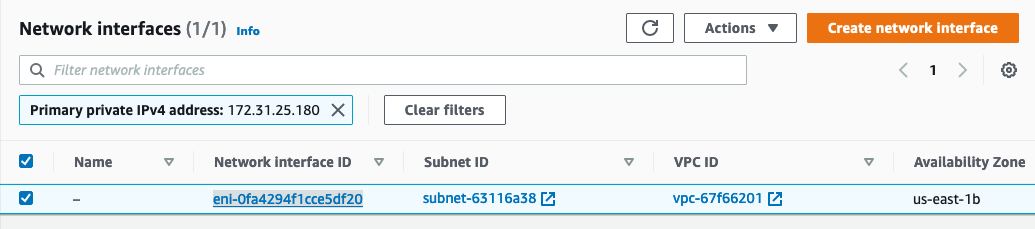
Get the network interface (ENI) attached to the DocumentDB instance. AWS doesn’t list this in the console for you, so the easiest way is to SSH into the monitoring instance and use
dig.dig <instance-hostname>, record the IP from the answer section
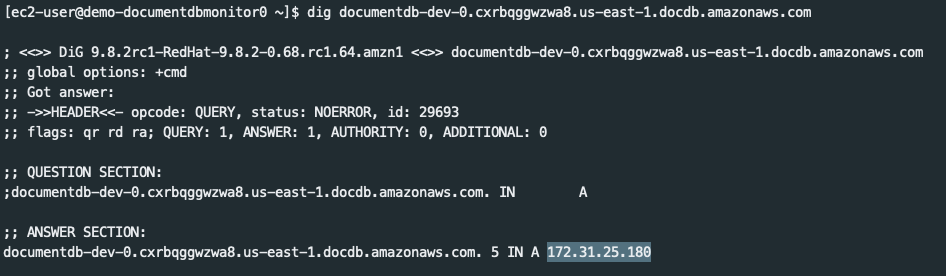
- Lookup the ENI by searching for that IP in EC2 > Network and Security > Network Interfaces.
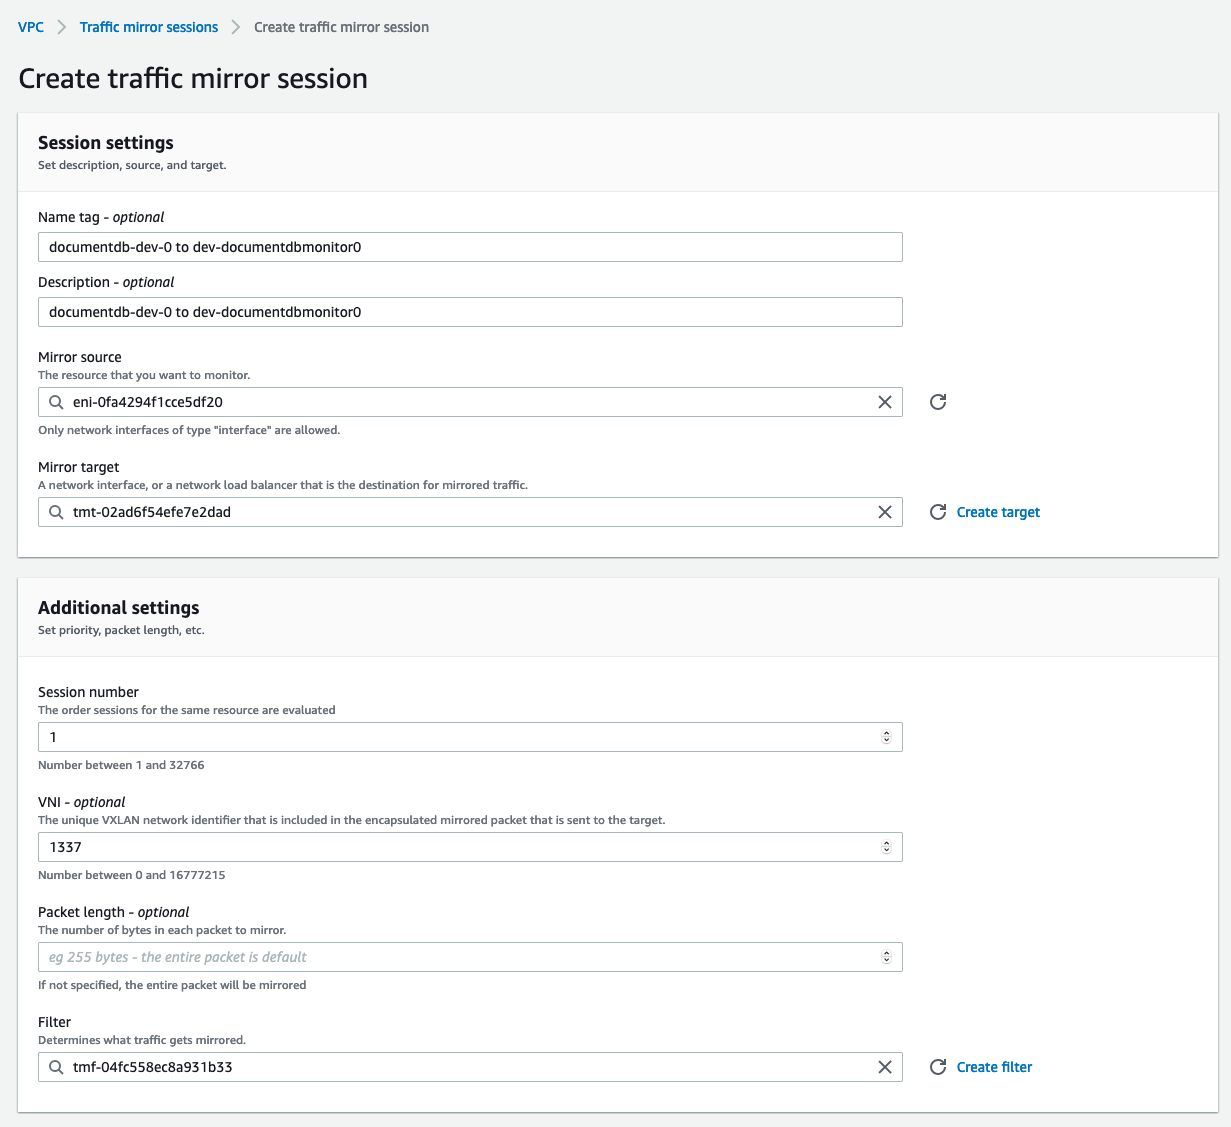
Create the mirroring session:
- source = instance ENI from previous step
- target = monitoring target from step 3
- VNI = VNI from step 2
- filter = filter from step 4
Repeat step 6 for each instance in the documentDB cluster.


With the monitoring instance set up with the vxlan and traffic mirroring sessions, you’re ready to install agents on the ec2 instance you created earlier. Follow the Add New Host Wizard in DPM under “Off-Host”, then “DocumentDB”. Provide the user credentials and cluster configuration (or cluster ARN) from earlier.
Amazon CloudWatch
We support downloading metrics from Amazon CloudWatch for your RDS or Aurora instance. This allows you to see system metrics, such as CPU and memory utilization, alongside your query data; this provides critical pieces of information necessary for diagnosing database issues. The list of metrics we collect from CloudWatch is here.
Important note: When monitoring Aurora instances the monitored address must be the instance endpoint, not a cluster endpoint or a read/write endpoint. This is required in order to fetch CloudWatch metrics, as well as ensure accurate database and query data.
To enable integration, you need to provide appropriate access to your AWS account. The agent must be running in the same AWS account as the database. There are three ways to provide access:
- Using the environment variables
AWS_ACCESS_KEY_IDandAWS_SECRET_ACCESS_KEY - Using the
/root/.aws/credentialsfile - Assigning the appropriate role to the instance running the DPM agent
Create a user which as the appropriate role (below) assigned. Provide credentials for that user either using the environment variables or credentials file. If providing credentials using the /root/.aws/credentials file, its contents look like this:
[default]
aws_access_key_id=AKIAIOSFODNN7EXAMPLE
aws_secret_access_key=wJalrXUtnFEMI/K7MDENG/bPxRfiCYEXAMPLEKEY
(The file must be in /root/, as that is the user which runs the DPM software.)
The AWS managed CloudWatchReadOnlyAccess and AmazonRDSReadOnlyAccess policies work, so make the user a member of a group that implements both of those. We strongly recommend using these managed policies, as they are future-proof and easier to implement.
If you opt to create a custom policy, it will need to include the following:
{
 "Version": "2012-10-17",
 "Statement":[{
        "Effect":"Allow",
        "Action":[
            "cloudwatch:GetMetricStatistics",
            "cloudwatch:ListMetrics",
            "rds:DescribeDBInstances",
            "rds:DescribeDBClusters",
            "rds:DescribeDBLogFiles",
            "rds:DownloadDBLogFilePortion",
            "logs:GetLogEvents"
        ],
        "Resource":"*"
     }
 ]
}
You should see CloudWatch metrics appear on your environment Summary page under the section “How healthy are the resources?” if the setup is correct. You will also begin to see data in the two CloudWatch dashboards, under Charts.
Google Cloud Monitoring via Stackdriver
We support downloading metrics from Google Cloud Monitoring for Cloud SQL. This allows you to see system metrics, such as CPU and memory utilization, alongside your MySQL or PostgreSQL query data; this provides critical pieces of information necessary for diagnosing database issues.
To enable integration you need to configure the Google VM running the DPM agents to have access to the Stackdriver API and you need to provide the agent with the Google Cloud Project ID and Instance ID for the database.
Enabling Access to the Stackdriver API
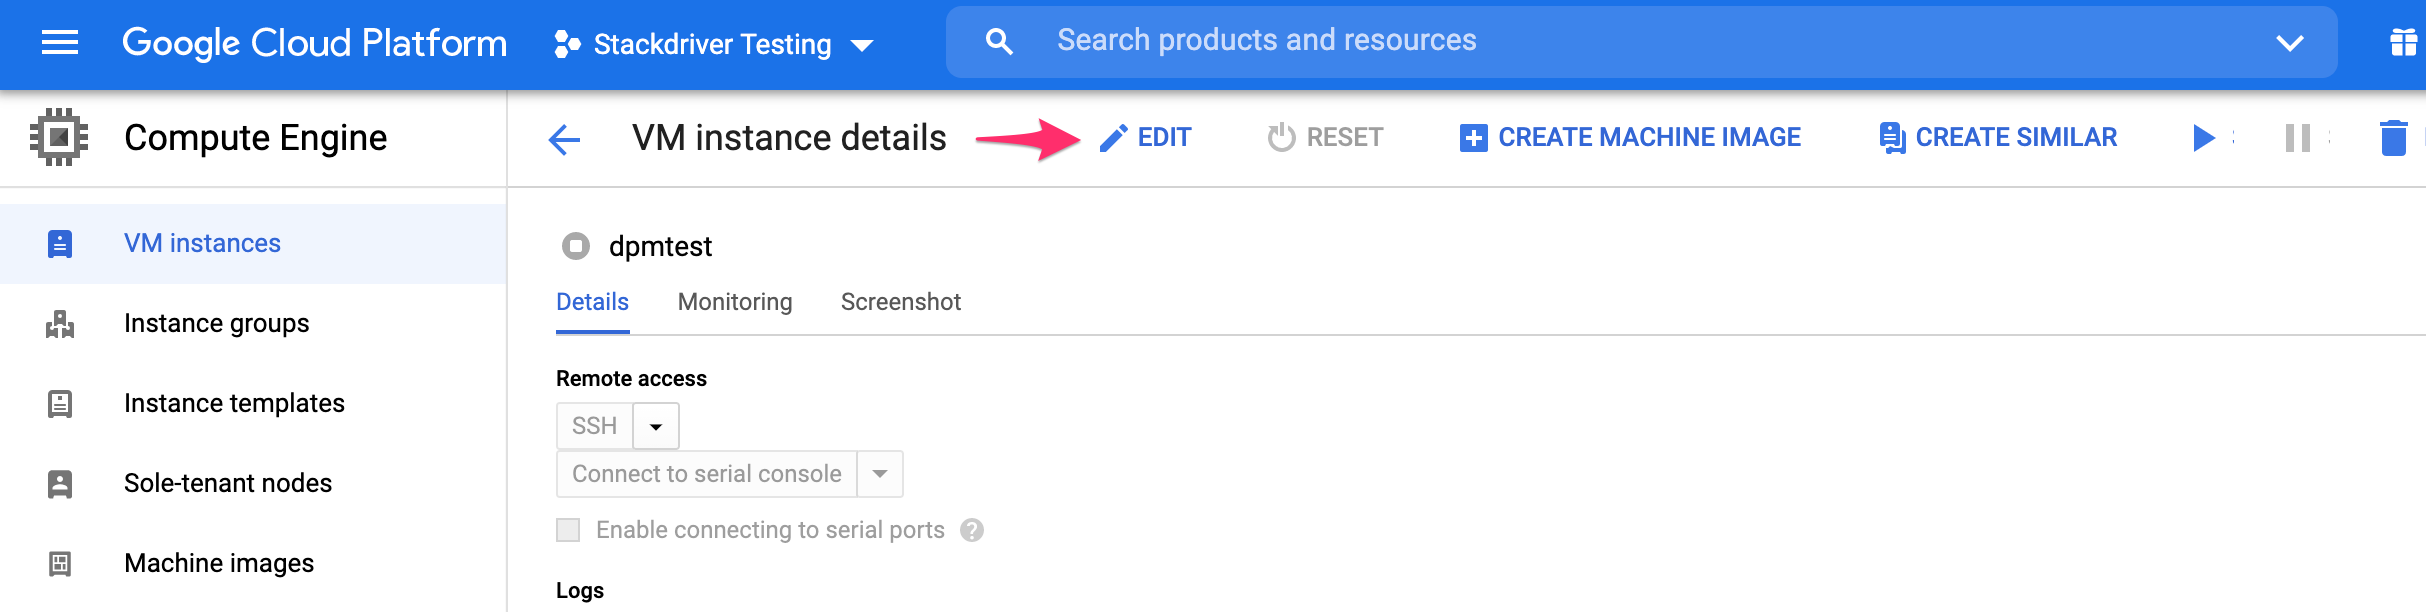
If you have not already created a VM instance for the DPM agents, you can grant Full access to the Stackdriver API while creating the instance. Otherwise, you will need to stop the VM instance to edit its API access scopes:
Find the instance where the agents are running, select it, and stop it.
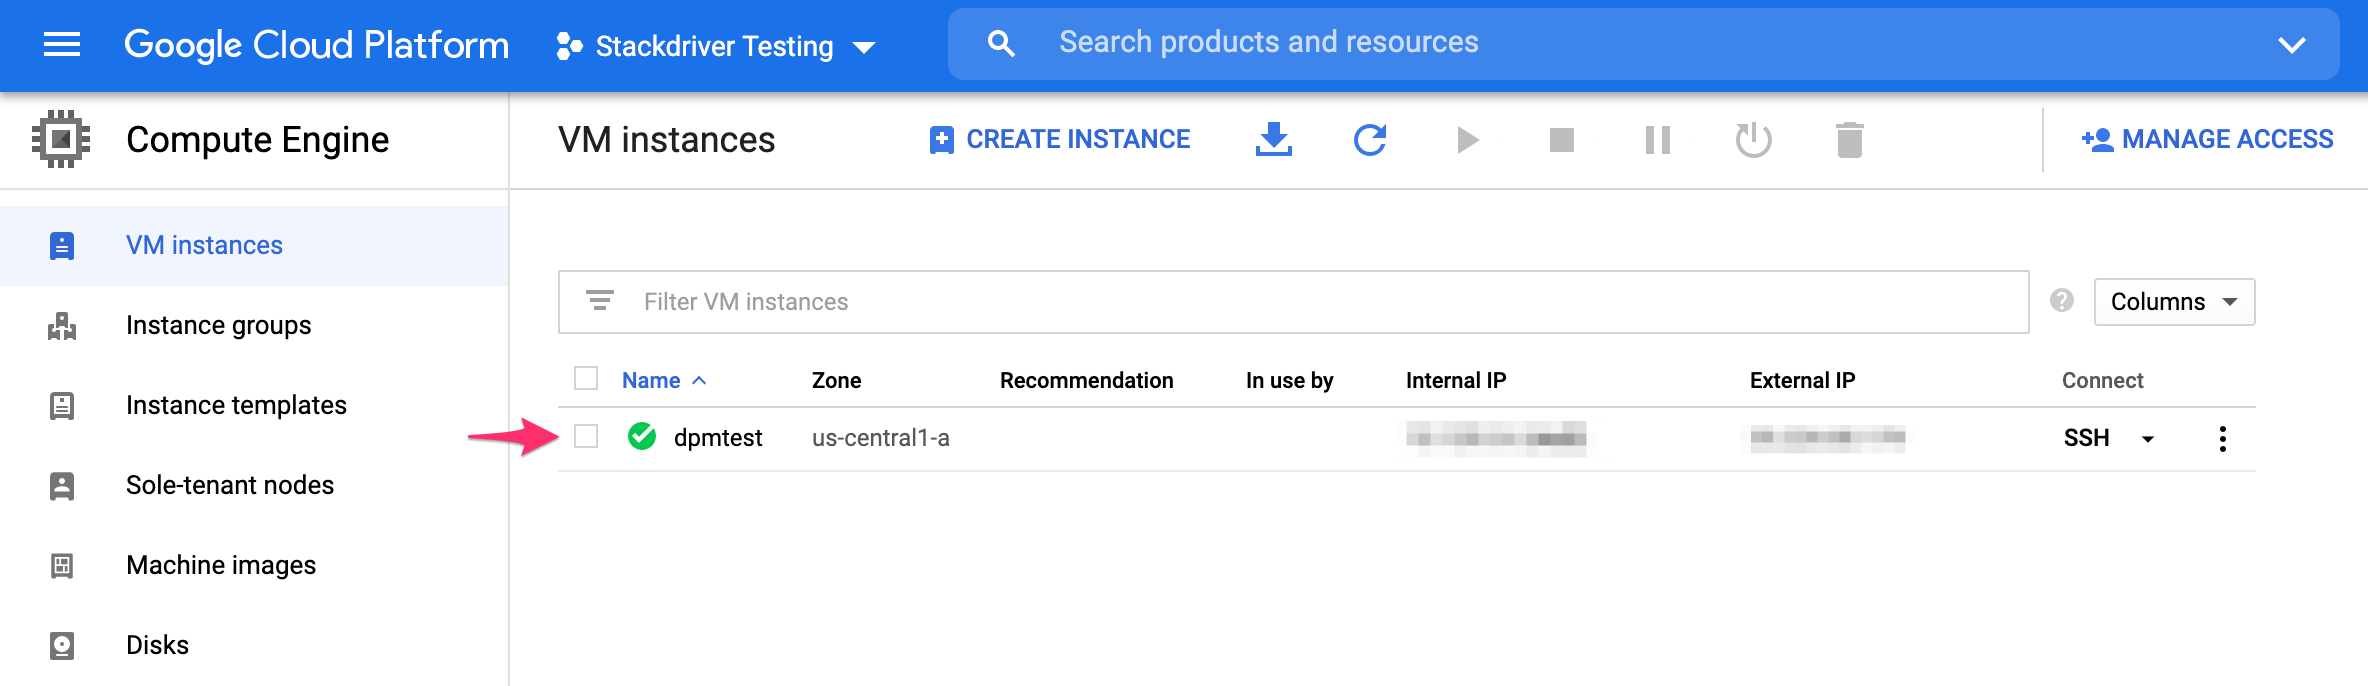
Then click to exit the instance.
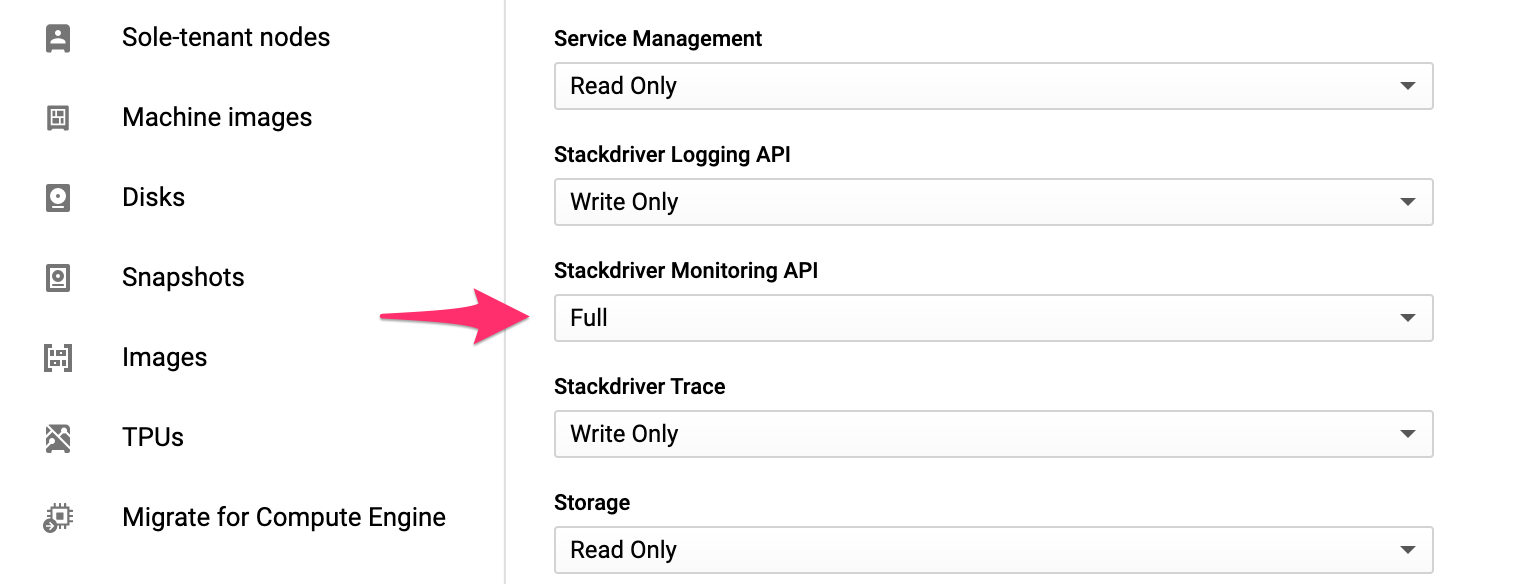
Scroll to the bottom of the instance’s settings and find the Stackdriver Monitoring API, and choose Full. Then click Save.
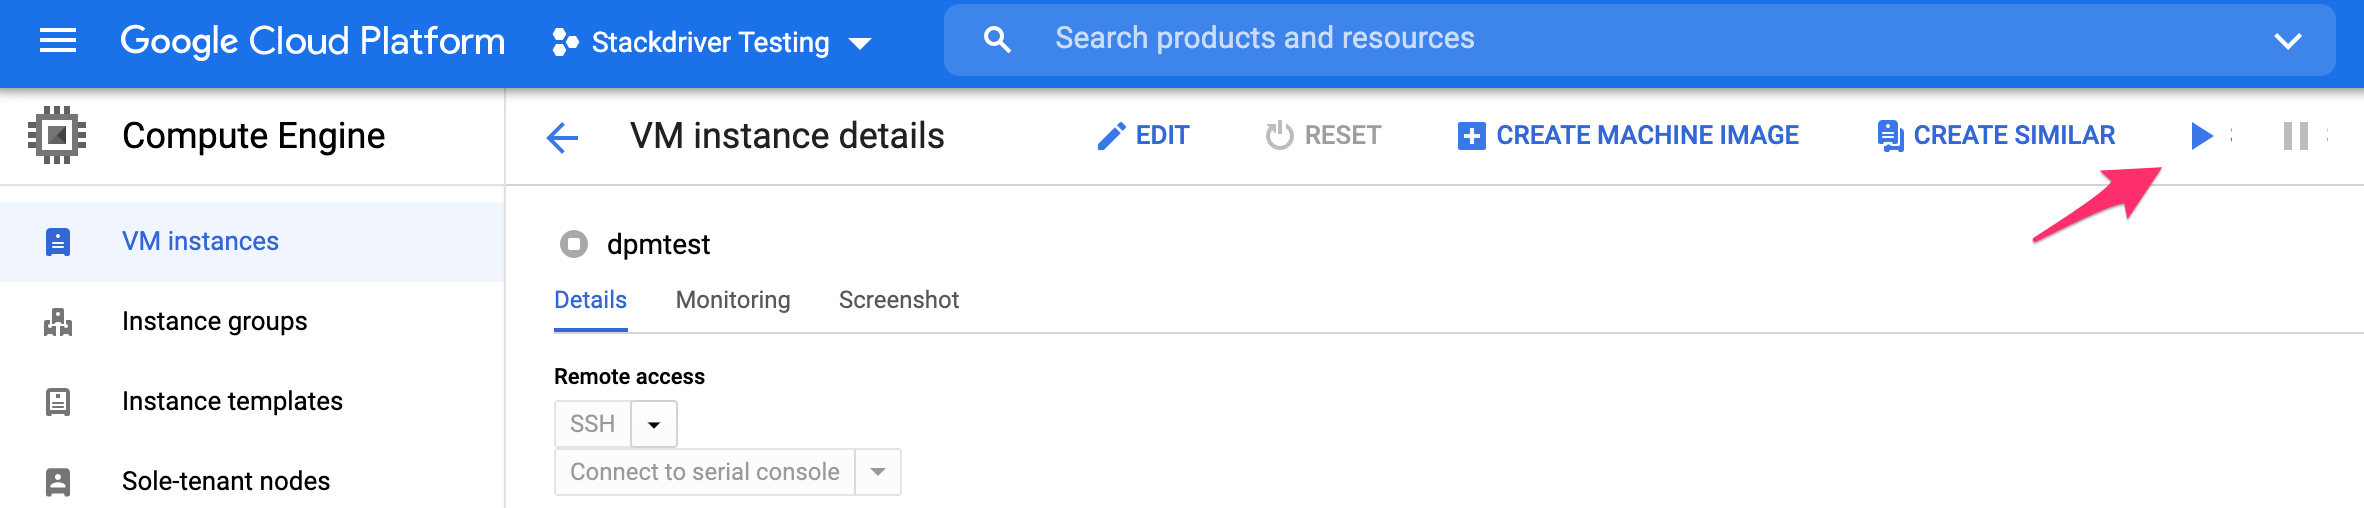
Restart the instance.
Providing Google IDs to the Agent
To configure the agent to fetch Google Cloud metrics via Stackdriver you will need to provide the Project ID and Instance ID to the DPM agent. First install the agent for MySQL or PostgreSQL. If you have not already enabled access to the Stackdriver Monitor API, do that now as well.
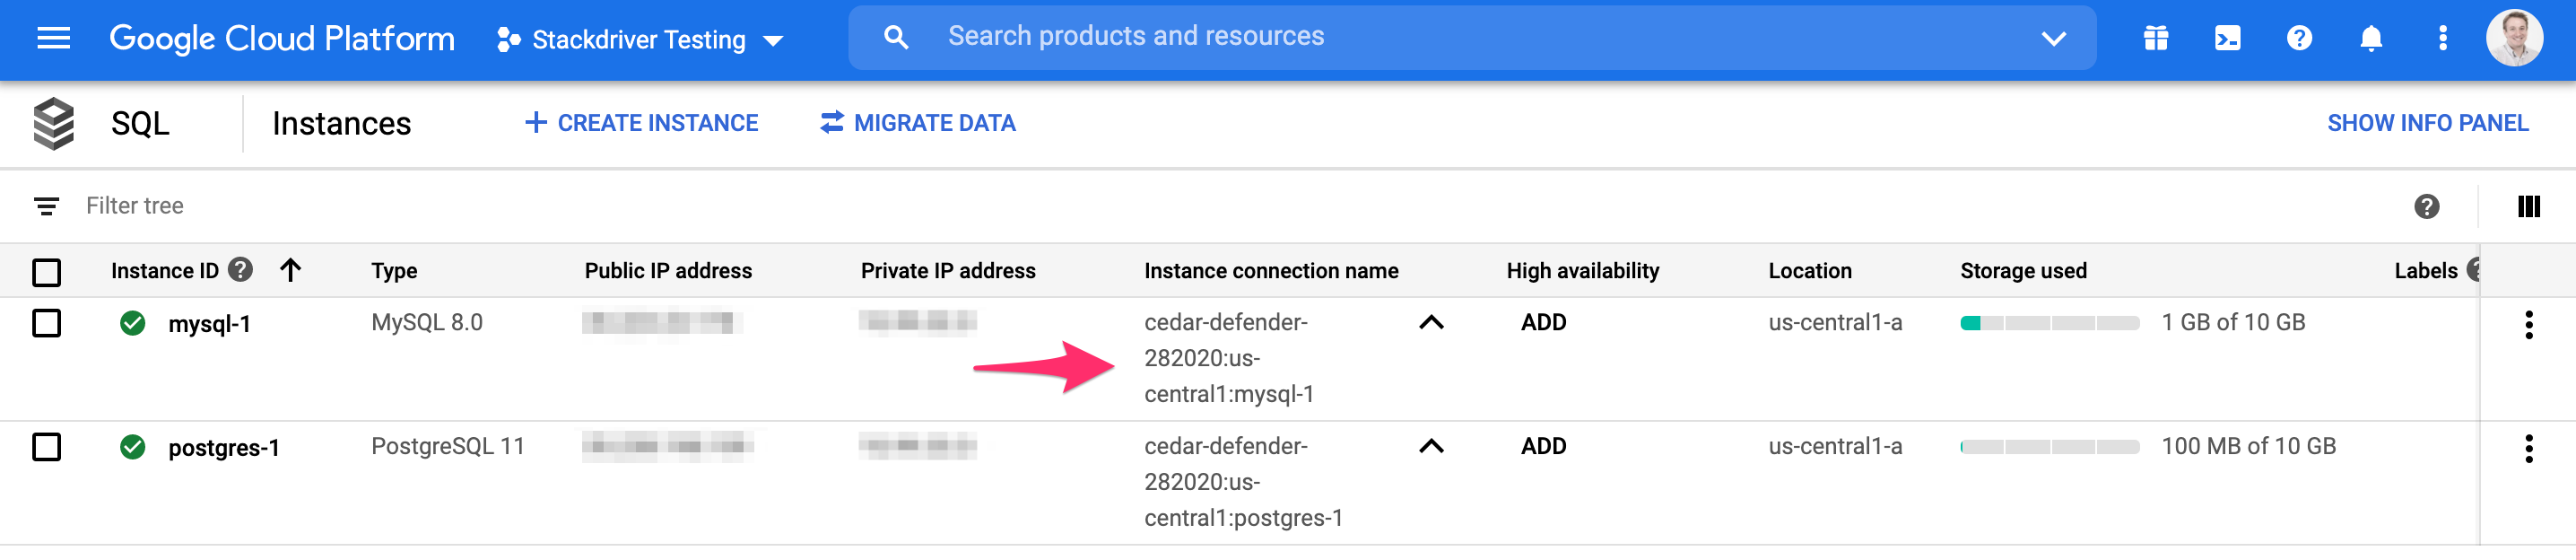
Next, find the Project ID and Instance ID. The easiest way to find both is to navigate to your SQL instances and find the Instance connetion name. This will contain the Project ID, a location (which is not needed), and the instance ID. In this example, cedar-defender-282020 is the Project ID and mysql-1 is the Instance ID:
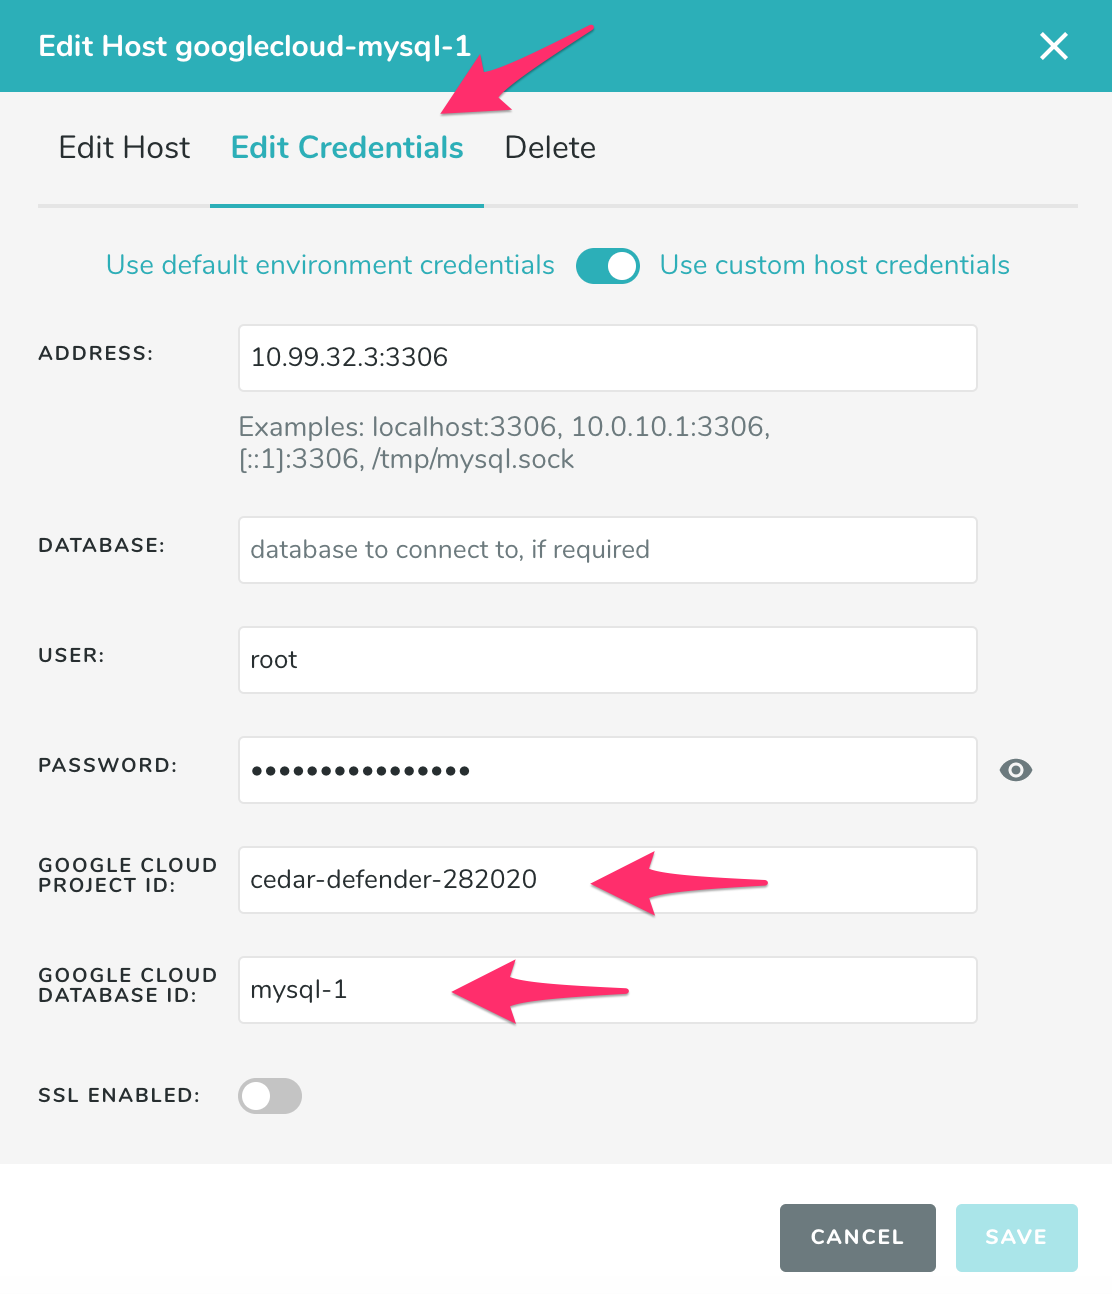
Open the Inventory page in DPM, find the database instance, and click to edit it:

Under Edit Credentials, enter the Project ID and Instance ID. Then click Save.
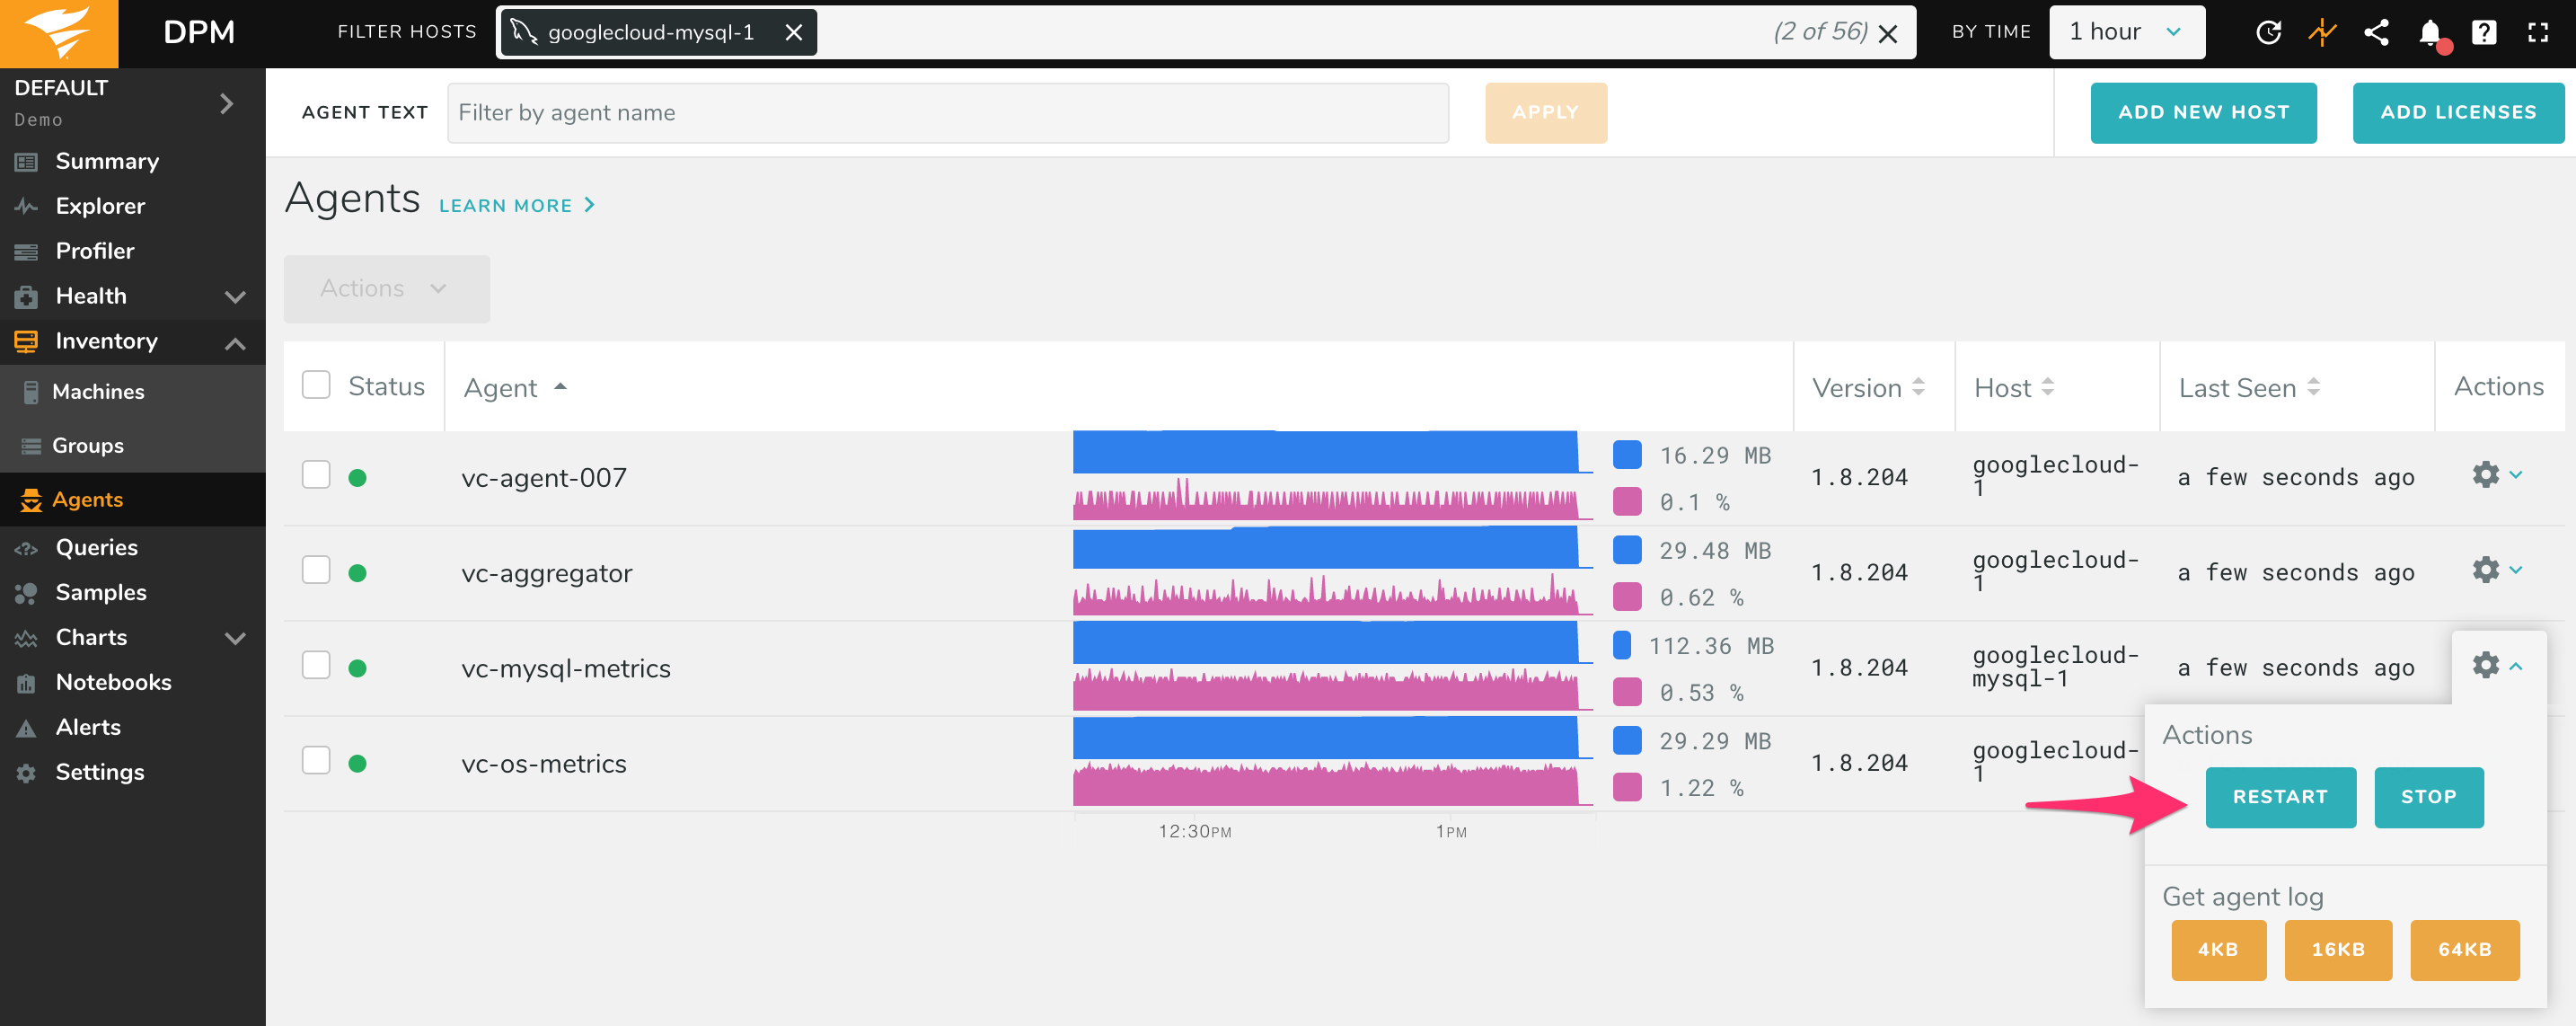
Restart the agent by going to the Agents page (under Inventory), finding the vc-mysql-metrics or vc-pgsql-metrics agent for that database, and clicking restart:
You should begin to see metrics for your Google databases within a few minutes.