Charts Dashboards
The Dashboards interface makes it easy to visualize the thousands of metrics Database Performance Monitor collects about your application’s queries, database, and infrastructure. Dashboards are simple to create and share, and have features such as chart captions that help make it easy to share knowledge and best practices.
For more information about the metrics these charts are based upon, see our metric categories reference doc, and for a description of each chart in DPM, see our chart descriptions.
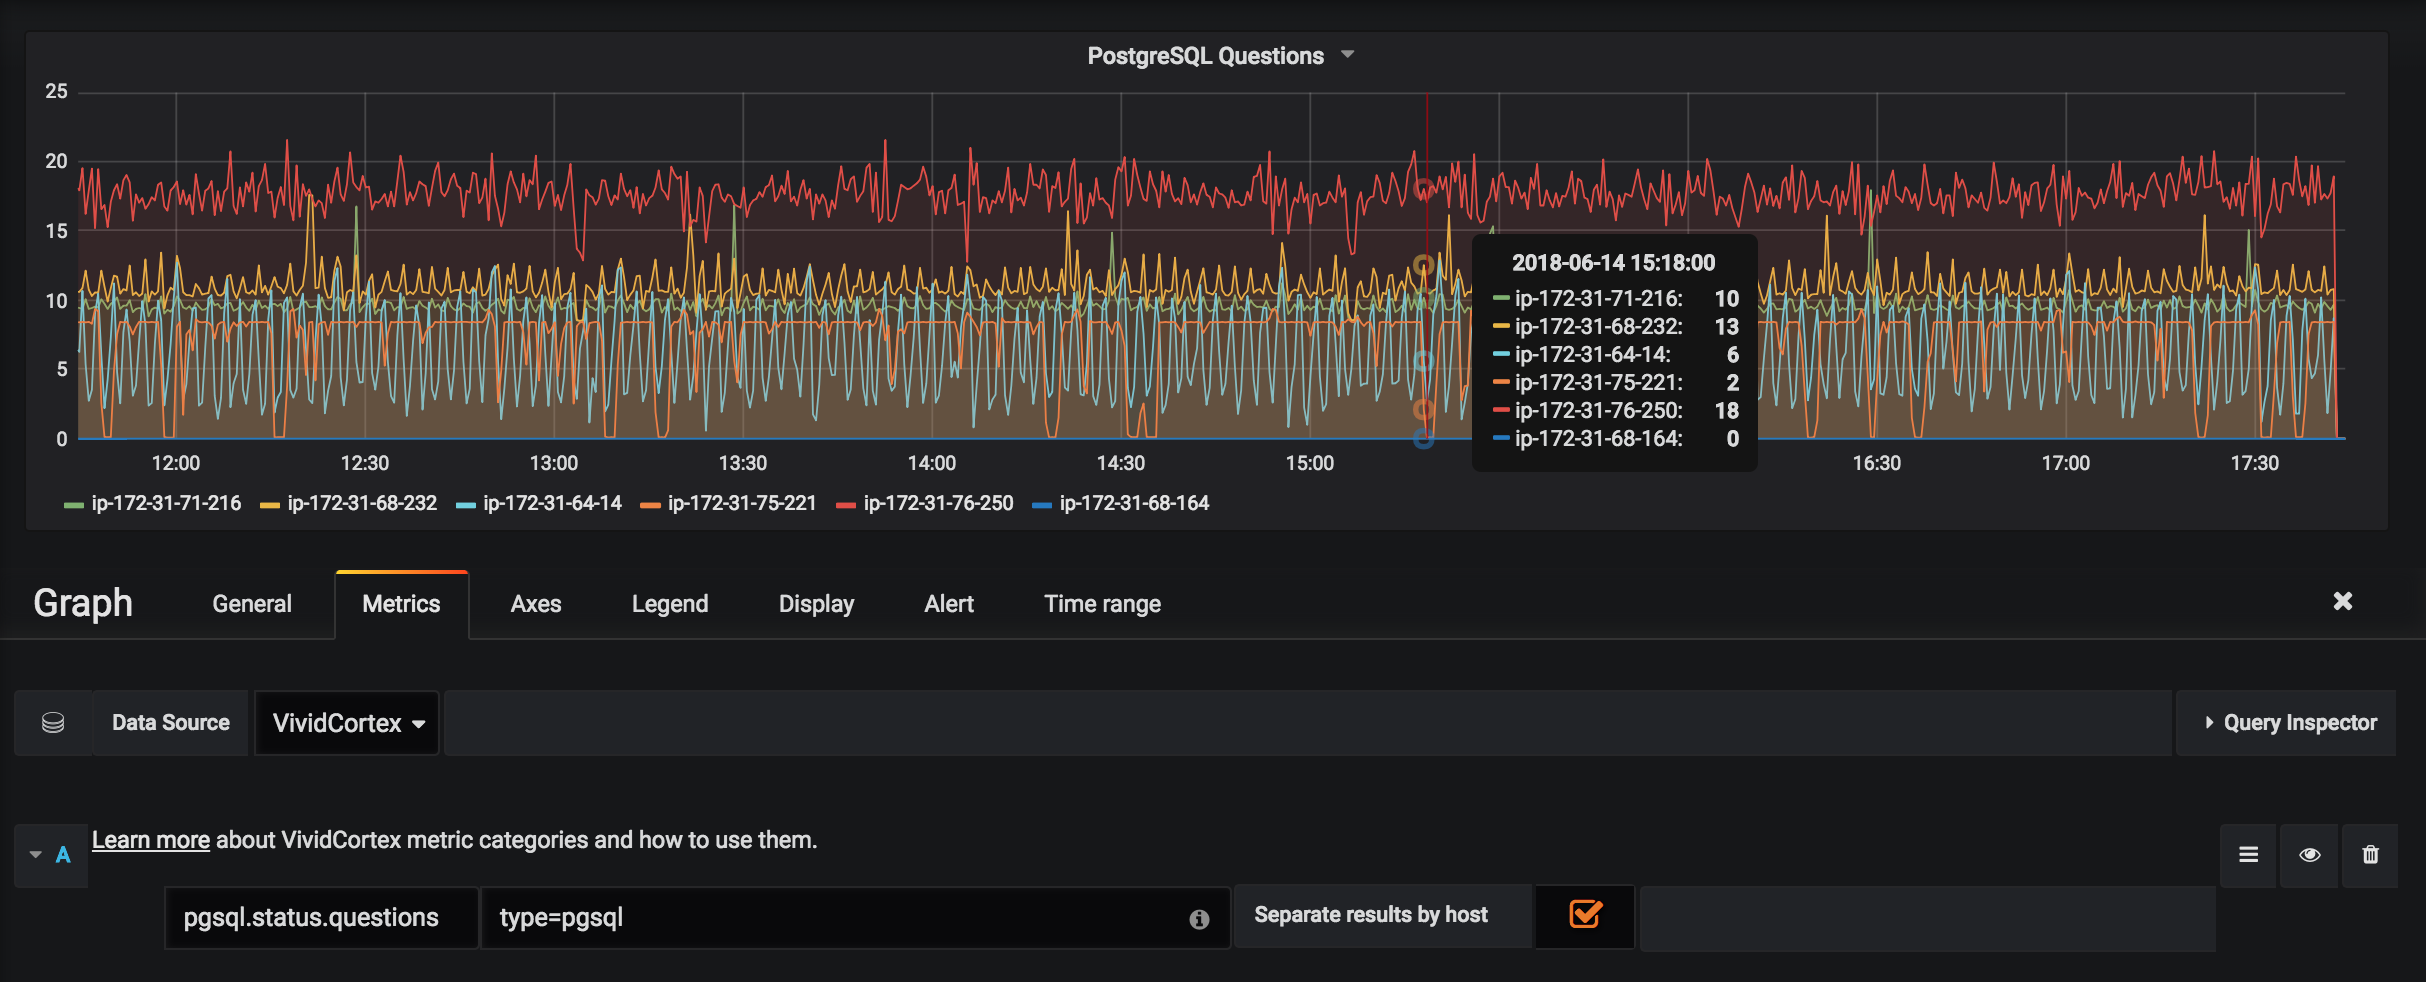
DPM also integrates directly with Grafana through our downloadable Grafana plugin, allowing you to view any of our thousands of metrics in the same dashboard your team already uses. For more information about getting started, check out our Grafana GitHub repo.
DPM Dashboards
We’ve included in DPM a set of the most commonly-used Charts and Dashboards, covering the most important key metrics for both database and system performance. A complete list of pre-built Dashboards is below.
Use the filter to search both annotations and the chart titles. You can sort by Name or by Last Updated.
Creating & Editing Dashboards
To create a new Dashboard, click “Add New Dashboard” in the top right corner. You can either create a new blank Dashboard, or use one of the DPM templates. Dashboards that you create will appear down the left side of the screen, along with the DPM templates.
To edit a Dashboard, select the Dashboard from the left hand nav and click “Edit” in the top right corner of the screen. This will open the Editing view. While in Edit mode, you can add content to your Dashboard and Preview how it will look. You can also Delete the Dashboard from Edit mode.
“Visibility” will let you choose who can see, edit, and delete this Dashboard. To let others view this Dashboard, such as for a set of KPIs for your entire team, choose “Anyone in this environment.” For a Dashboard you’d like to keep to yourself, choose “Only me.”
Changes are not automatically saved, so click “Save” to keep the changes you’ve made. You can click “Close,” or leave the page, to discard changes that you’ve made. The app will warn you if you close Edit mode or leave the page without saving.
Title and Description
Your Dashboard can have a title and a description. These are automatically the first two lines of the Dashboard’s source text.
For example, this source text …
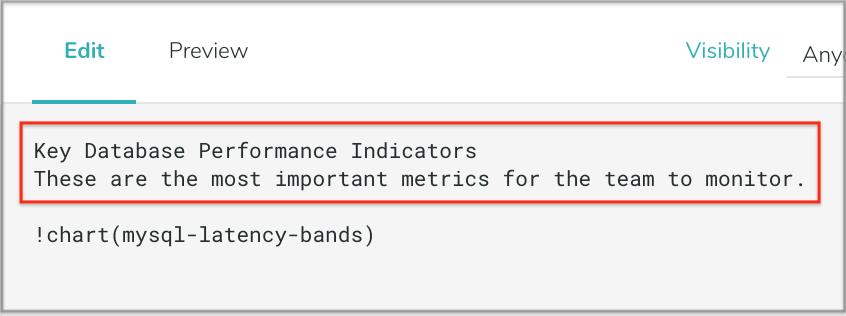
… becomes the title and description:
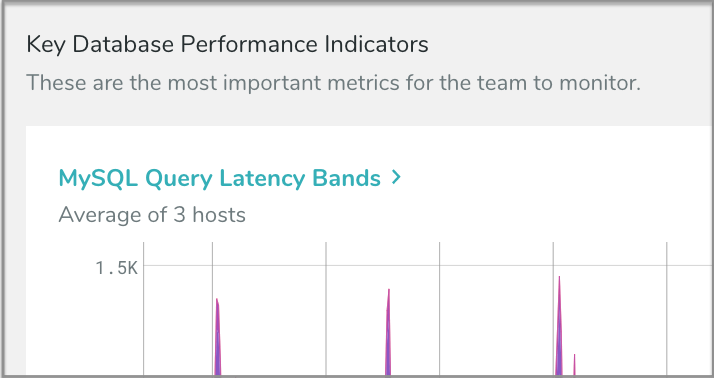
Adding Charts to a Dashboard
You add Charts to Dashboards using a simple Markdown-inspired syntax. Chart definitions are three lines:
Chart Title
Chart Options
Optional Chart Description. Help viewers understand the chart.
There are two options for Charts: pre-built Charts created by DPM for key database and system metrics, and user-defined charts built using DPM metric names. Using the DPM charts allows you to build a custom Dashboard quickly, while creating a custom chart will let you see any of the thousands of metrics we collect.
Pre-built Charts
To use a pre-built Chart, use the following syntax:
!chart(chart-name-here)
When you type !chart( a list of chart names will appear. Type to search for the chart you need, and then press Enter. It will auto-complete for you.
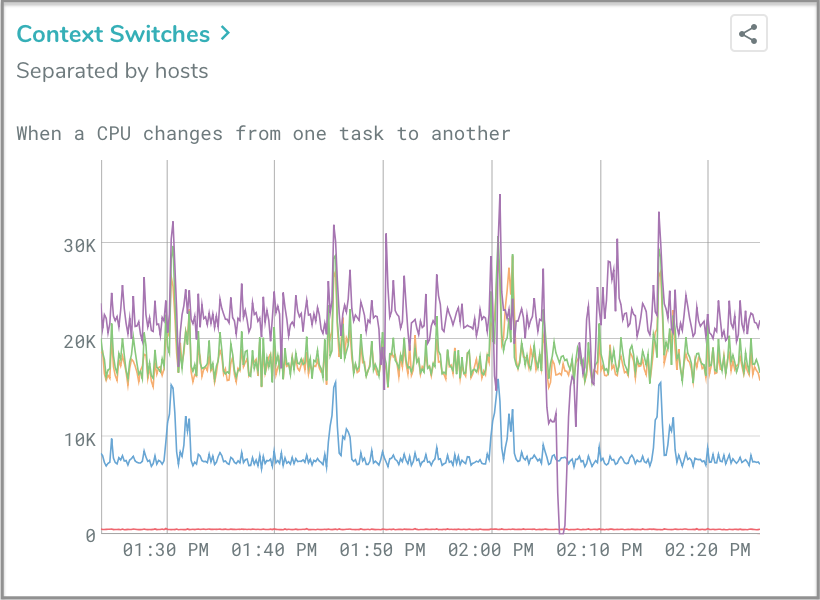
Here is an example. This is Edit mode…
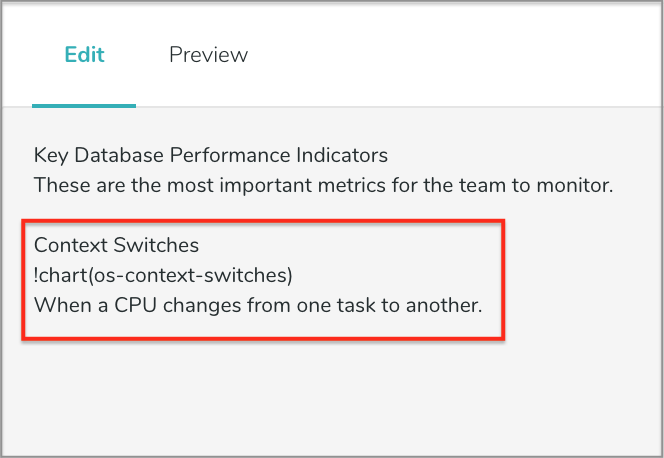
… which will be displayed as:

In the above example, the metric is being averaged across the selected hosts. To see each host on its own line, the syntax is: !chart(os-context-switches, breakdown=by-hosts):
Note that you can only see a chart broken down by host if the chart has one metric.
Custom Charts
In addition to the Charts DPM has created, you can create your own by specifying a metric (or combination of metrics) that you would like to visualize. To do this, use the following syntax:
!chart(metrics=[example.metric_a, example.metric_b])
When you type !chart(metrics=[ a list of metrics will appear. These will autocomplete as well. To search the list of Metrics collected in your environment, visit the Metrics page, or consult our Metrics documentation.
Here is an example. This is Edit mode…
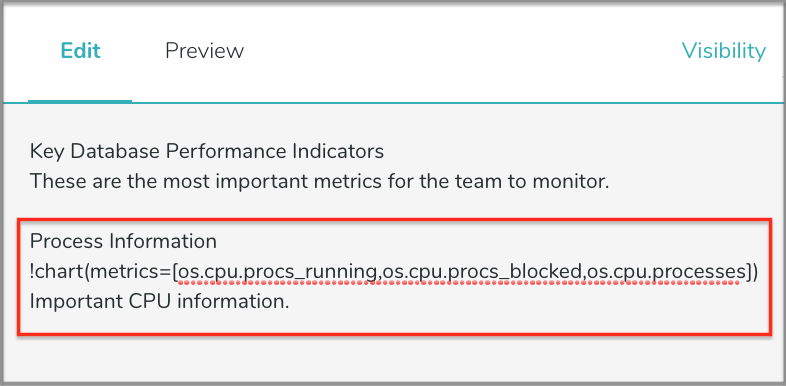
… which will be displayed as:

Like with the pre-built Charts you can also see a DPM metric visualized with one-line per host. To see a breakdown by host, your chart must contain only one metric.
Here’s an example in Edit mode…
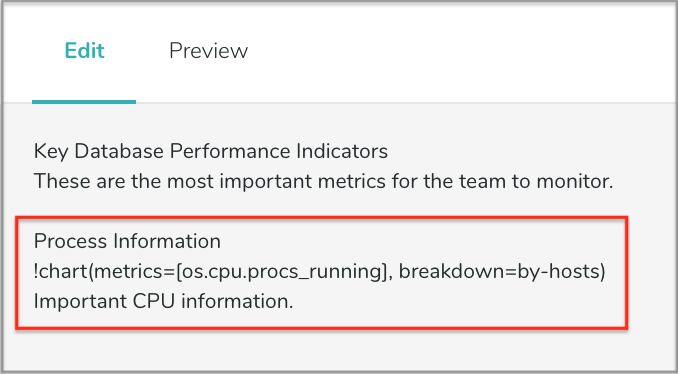
and how it will be displayed:
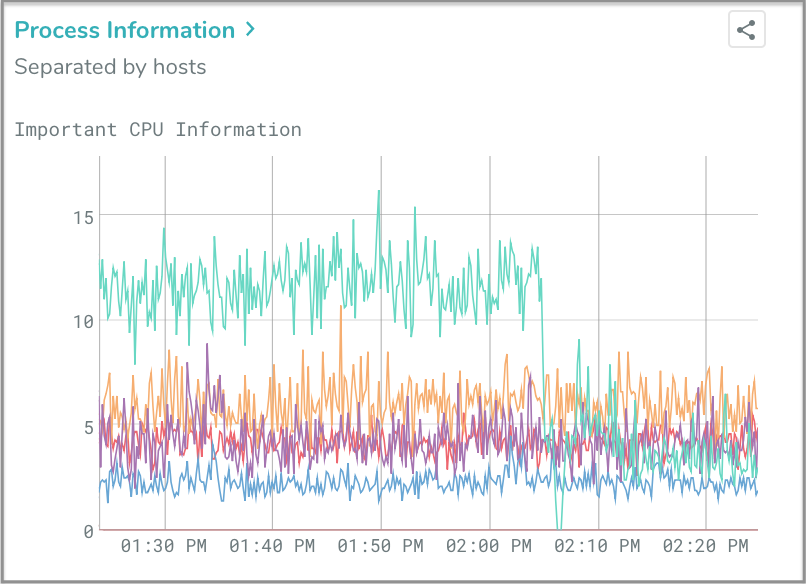
Up to 10 hosts can be charted in this way.
All of this information can also be found in the application by clicking “Guide” while editing a Dashboard. There you will find samples which you can copy and paste into your own Dashboard.
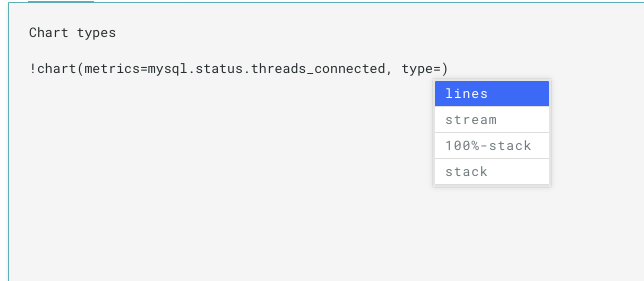
Chart Types
Chart information can be visualized in different ways, based on the configured chart type. Four types are available: lines, stream, stack, and 100%-stack. To change the type for a custom chart, edit the chart and add “type=” in the chart configuration as shown below:
Pre-Built Dashboards
The following is a list of pre-built Dashboards, which can be viewed or used as a template. For a description of all of the charts in these dashboards, see our chart descriptions.
| Dashboard Name | Dashboard Description |
|---|---|
| CPU | CPU utilization, context switches, and processes running, and others. |
| Disk | Disk latency, disk space, and I/O operations, and others. |
| InnoDB | InnoDB engine data, such as transaction metrics, buffer and cache data, and data operations. |
| Machine View | OS and database metrics (MySQL, PostgreSQL, and MongoDB) with multiple hosts on one chart. |
| Memory | Memory usage, swap usage, and swap activity. |
| MongoDB | The complete set of MongoDB charts, including latency and MongoDB internals. |
| MongoDB KPIs | Key MongoDB metrics with descriptions, such as latency, cursor operations metrics, cache activity, and latency. |
| MySQL | The complete set of MySQL charts, including latency and MySQL internals. |
| MySQL CloudWatch | CloudWatch metrics for your RDS for MySQL instance. |
| Network | Bytes sent and received, packets sent and received, and connection states. |
| PostgreSQL | The complete set of PostgreSQL charts, including latency and PostgreSQL internals. |
| PostgreSQL CloudWatch | CloudWatch metrics for your RDS for PostgreSQL instance. |
| PostgreSQL KPIs | Key PostgreSQL metrics with descriptions, such as latency, buffers, lock and vacuum information, and cache data. |
| Redis | Redis latency, commands, connections, keyspace, RDB, and other metrics. |
DPM Grafana Plugin
DPM integrates directly with Grafana through our downloadable plugin. To get started, download the plugin here.