Metrics Page
The Metrics page allows you to view and compare individual metrics while filtering by metric name and host. All data time-series collected by DPM, including per-query data, can be viewed through this interface. DPM collects more metrics than are displayed by default in the Charts Dashboards and they can be viewed here. For a list of metric categories, which you can use when searching, see here. The Metrics page is available by clicking “Charts” in the left-hand nav bar, and then selecting “Metrics” at the top of the window.
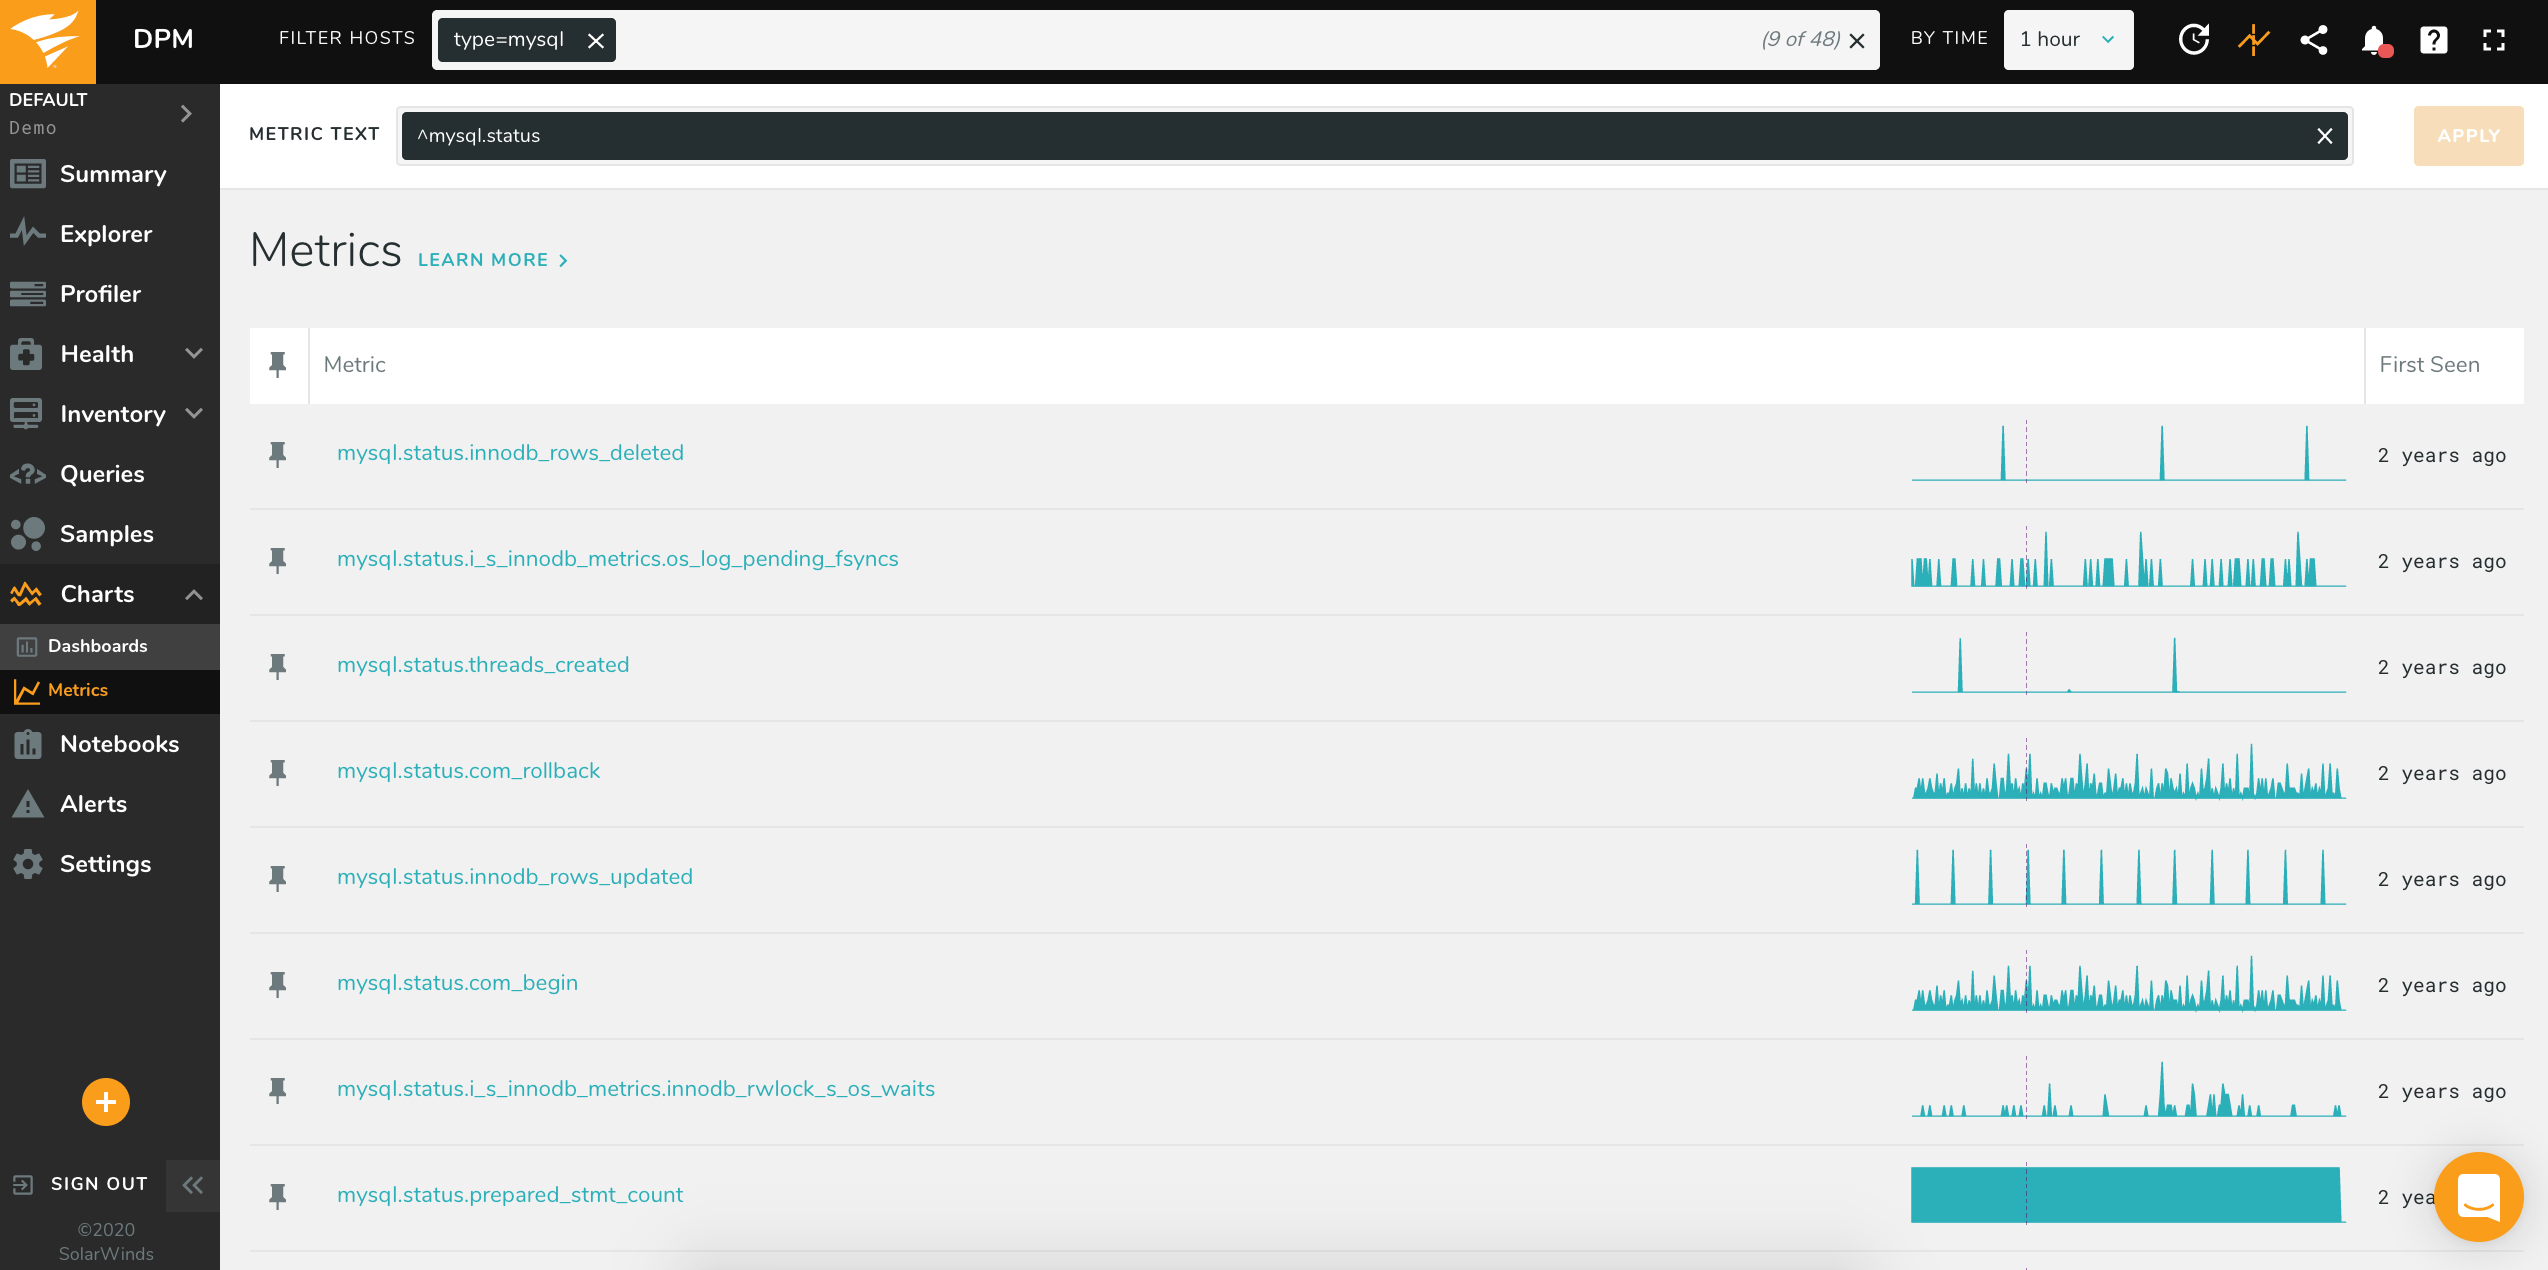
You can filter on specific portions of the metric name. For example, if you would like to filter by CPU metrics, you would input os.cpu.
The Main Table
The main area of the UI shows a high level overview of each metric. Hovering over a sparkline will give you the value of each metric shown (at that particular point in time).
- Metric shows the metric name, as well as a time-based representation of that metric.
- First Seen shows the date the metric was first seen by the application.
Pinning
Pinning allows you to save a small collection of metrics, and show that collection at the top of the table, which can be useful when comparing multiple metrics to one another. To pin a metric, click the ‘pin’ icon to the left of the metric. This will move the metric to the top of the table, and will remain at the top even when paging or refreshing the browser.
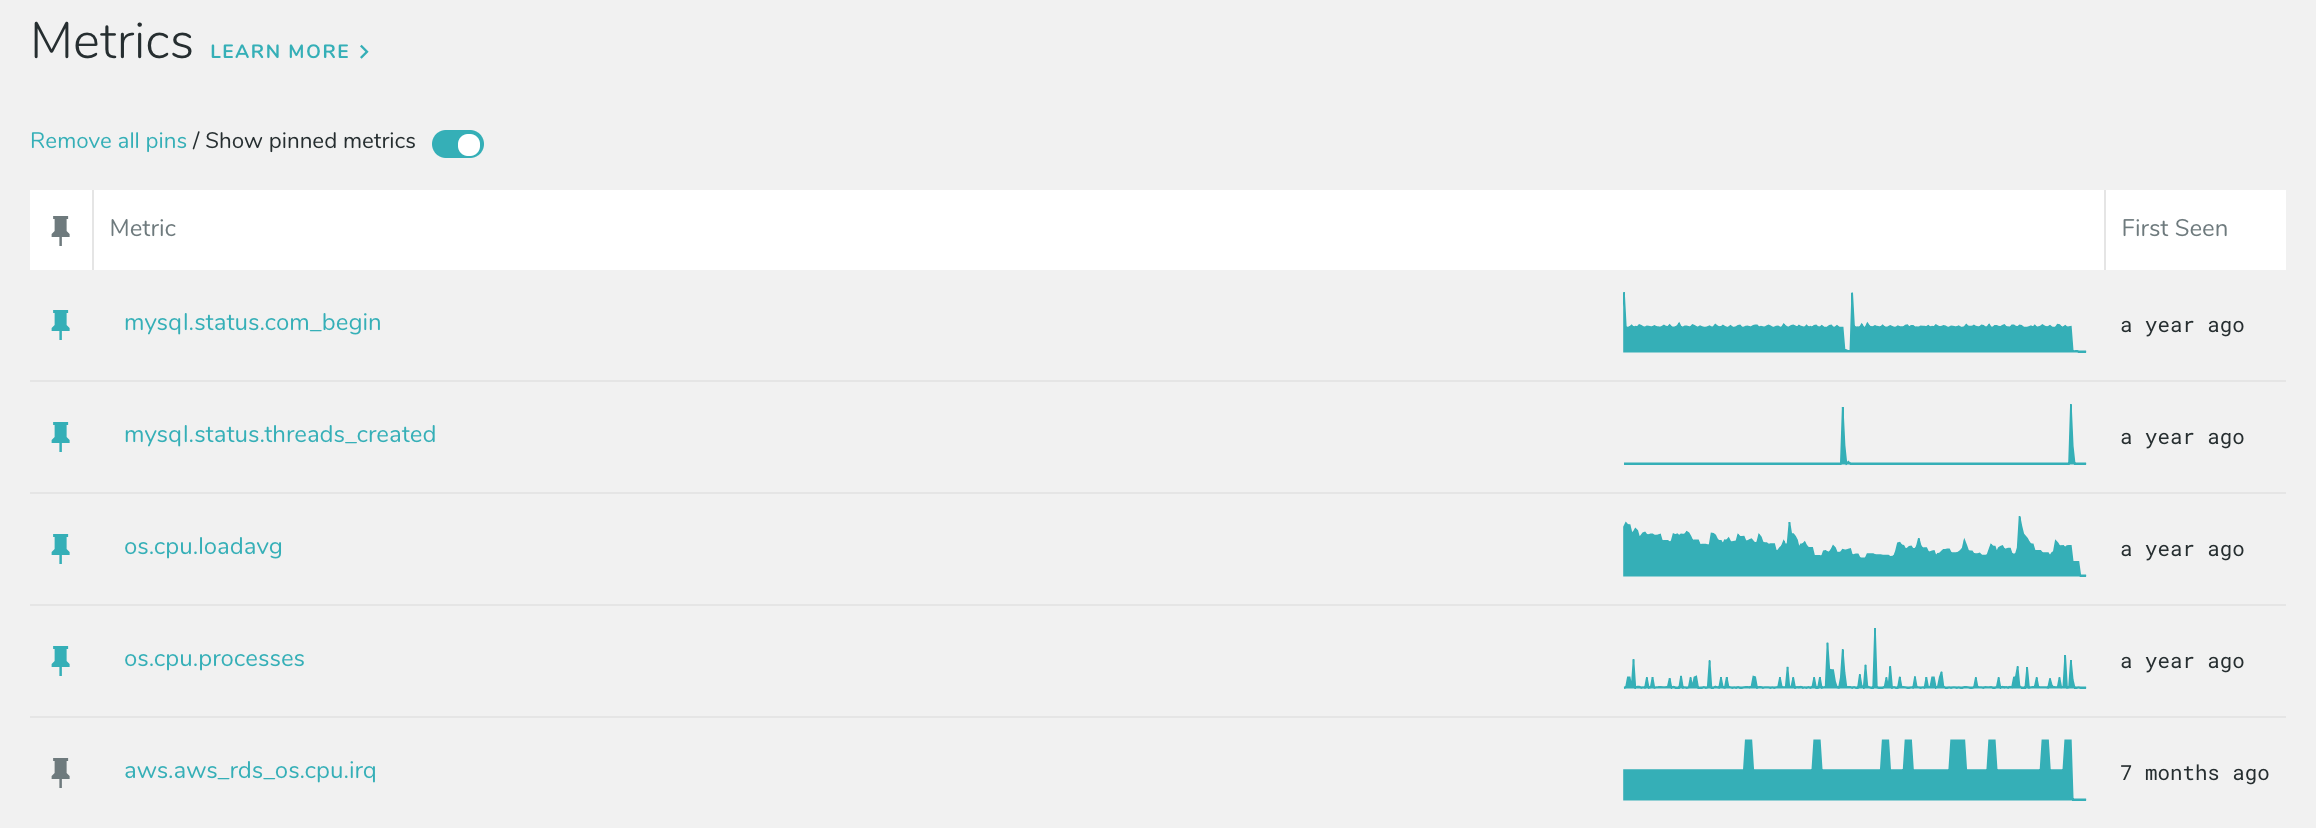
You can hide pinned metrics by switching them off using the switch in the top left corner above the table.
To remove a pinned metric, click the colored icon to the left of the metric. Or, you may remove every pinned metric by clicking “Remove all pins” in the upper-left corner above the table.
Metric Details
Clicking a metric in the table takes you to that metric’s details page, which shows more information including a time-based representation of that metric and a host breakdown.

All metrics are per-second. When hovering over a chart to view its value, the number shown will be some value per-second. When viewing a long time frame, individual seconds are averaged together. Because of this averaging, peaks in data may be shown as less than their maximum value if you are viewing the chart at a resolution other than per-second. For example, if you are viewing a long time frame and each point on the chart represents 15 minutes, the value displayed is the per-second average for that 15 minutes.
Metrics are not displayed with units; the metric name typically includes some indication of the units the metric represents, such as bytes, packets, count, etc. When viewing metrics, you may see a letter suffix, such as 10G or 35m. They represent values to a power of ten. We use the following standard SI values:
| Symbol | Decimal | Description |
|---|---|---|
| T | 1 000 000 000 000 | trillion |
| G | 1 000 000 000 | billion |
| M | 1 000 000 | million |
| k | 1 000 | thousand |
| m | 0.001 | thousandth |
| μ | 0.000 001 | millionth |
| n | 0.000 000 001 | billionth |
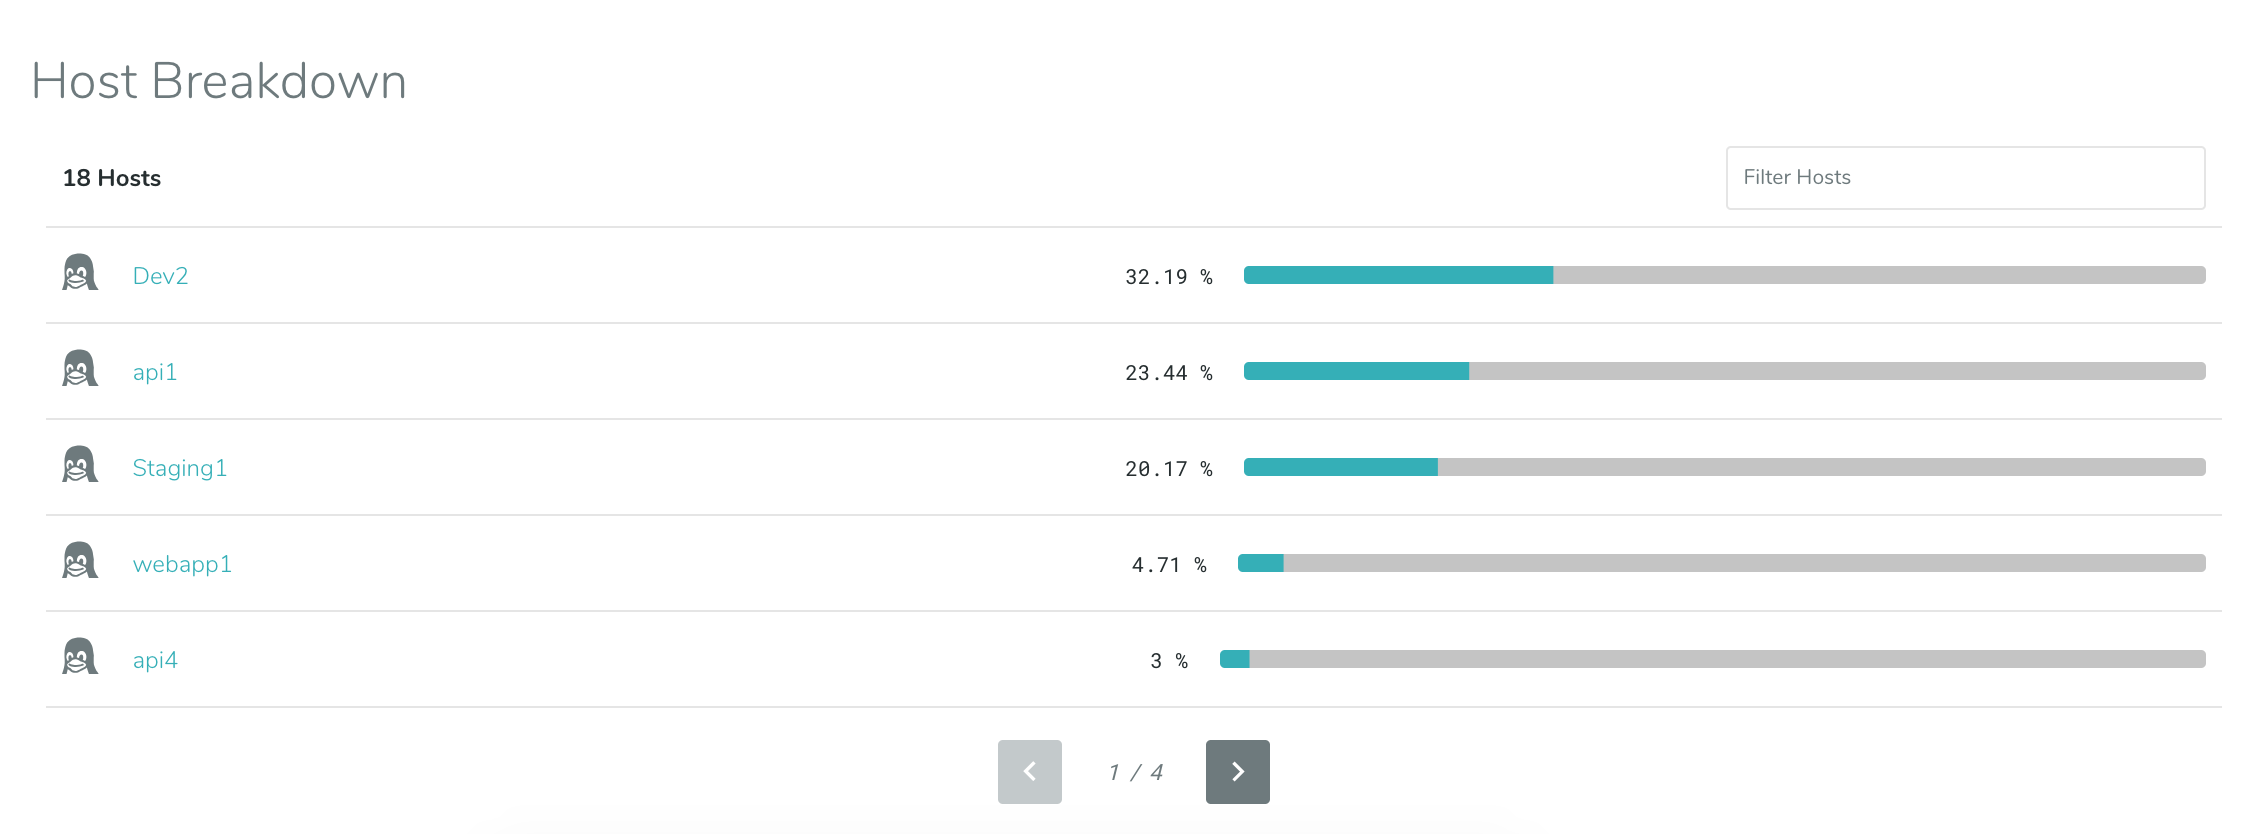
Host Breakdown
The Metric Details page shows the hosts which contributed to the metric, and the percentage of the metric’s total that was contributed by each host.