Summary Page
The Summary page is the homepage for each environment. It focuses on the core set of database metrics that matter most: concurrency, errors, latency, and throughput (CELT) – the four “Golden Signals” of quality of service.
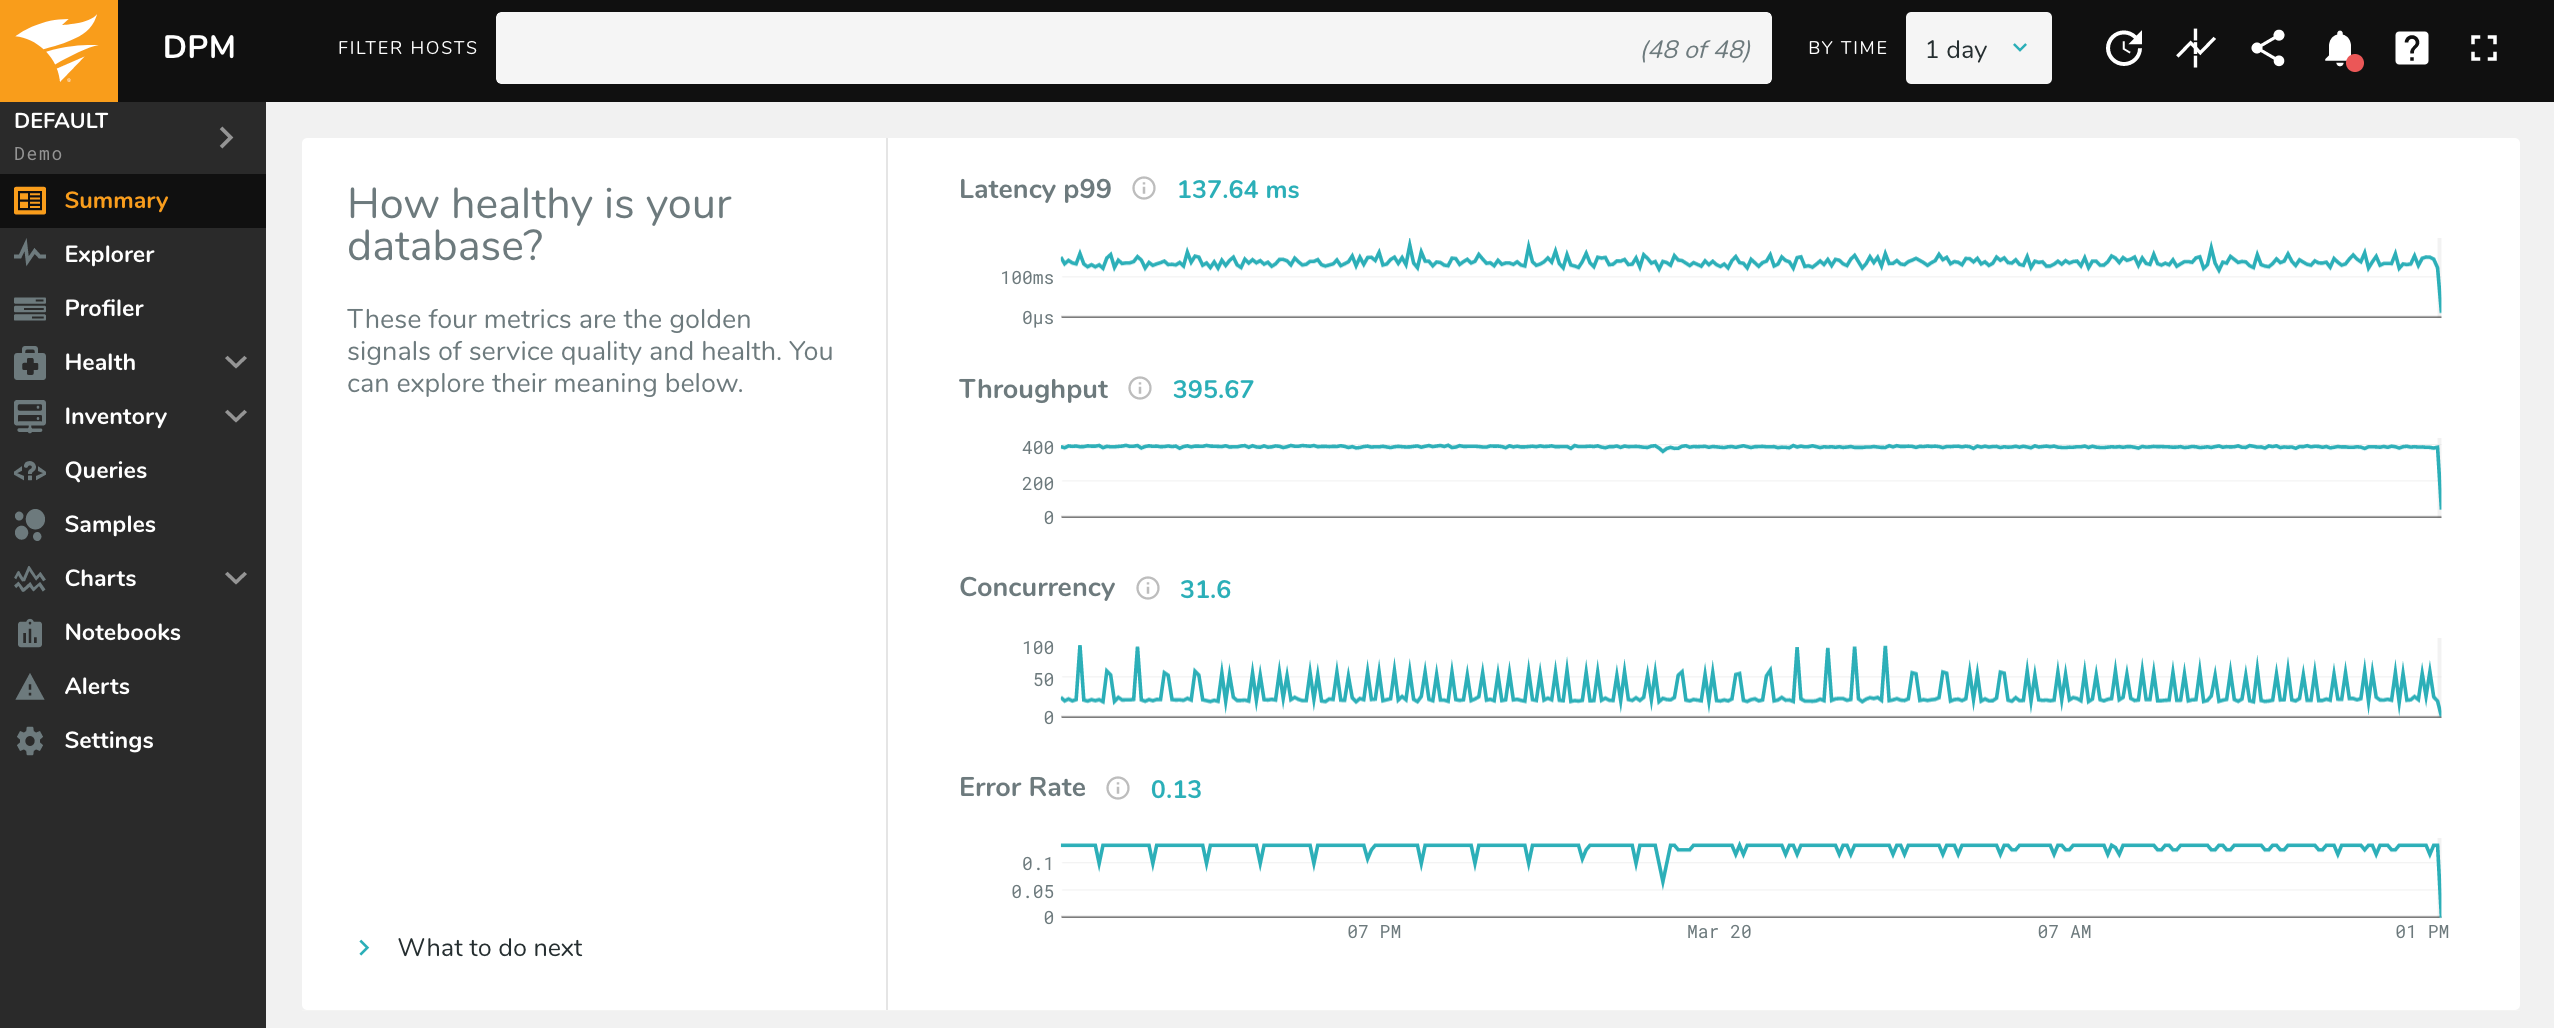
Use the Time Picker to select a timeframe for which to view metrics, and use the Host Filter to narrow your data to a specific host (or set of hosts).
Each of the sparklines are totals for your hosts, except for p99 latency (which is inherently an average of all queries on all hosts). For example, Throughput is the total count of queries for all hosts you have selected, not the average for each host. Memory Utilization is total utilization across all hosts, not the average host’s utilization. To view metrics for an individual host, simply select that host in the Host Filter.
These are the metrics used for each sparkline (you can also get additional information by hovering over the “information” icon in the app):
Concurrency: Concurrency is the number of queries which executed simultaneously per second. For a given second, it is equal to the total database time (
host.totals.queries.time_us).Throughput: This is a count of queries completed per second (
host.totals.queries.tput). This is calculated directly by counting queries when On-Host, and comes fromperformance_schemaorpg_stat_statementswhen Off-Host.Error Rate: The per-second rate of errors returned by the database (
host.totals.queries.errors.tput). For On-Host configurations, errors are reported by the database in the query responses. For MySQL Off-Host, this data comes from the performance_schema. This data is not available for Off-Host PostgreSQL.Latency (p99): For clients monitoring with the On-Host configuration, p99 represents the 99th percentile latency (
host.totals.queries.p99_latency_us). In other words, 99% of queries were faster than the given latency. For clients monitoring On-Host, we compute this latency from the individual latency of each query. For clients monitoring Off-Host, this sparkline displays the average latency: total number of queries divided by time (host.totals.queries.time_us/host.totals.queries.tput).
Below the CELT metrics are key utilization and throughput metrics about hardware resources. These metrics give you the insights you need to assess your database’s performance and health – without visibility into system resources, assessments of database health are incomplete. For RDS instances, this data comes from CloudWatch. For more information on integrating CloudWatch with DPM, see our documentation here.
These are the metrics for each resource sparkline:
CPU Utilization: % CPU utilization, from
/proc/stat.Network Throughput: Total number of bytes sent and received by the host, per second (
os.net.rx_bytes+os.net.tx_bytes). These are retrieved from/proc/net/dev.Disk Throughput: Total number of reads and writes, per second (
os.disk.tput). This comes directly from/proc/diskstats.Memory Utilization: % of memory available. This comes from
/proc/meminfo. For RDS clients, this will be instead Freeable Memory, the amount of memory available, in bytes.
What to do next
In the bottom left-hand corner of the CELT section is a link to “What to do next.” Clicking it opens a new page section:
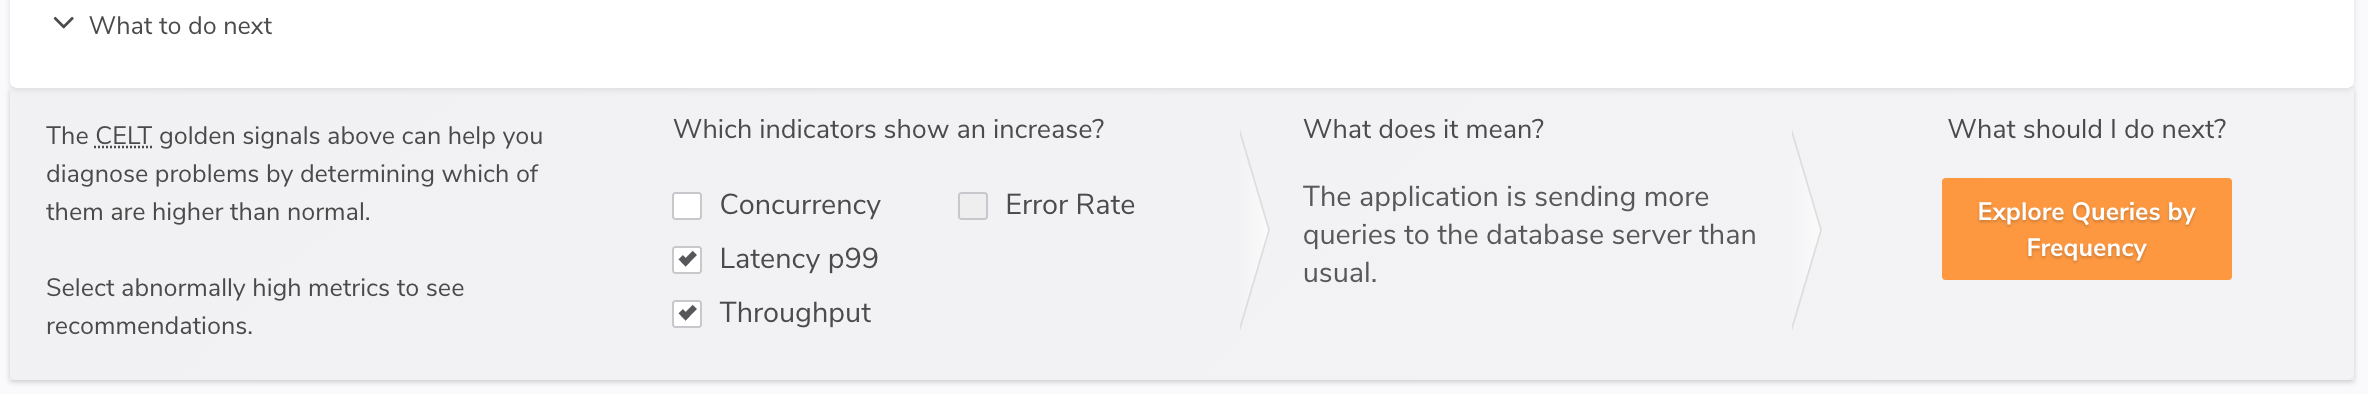
By using this section you can get guided help on understanding a change in metrics. Select which of the four metrics are showing an unexpected increase and then click “Explore Queries by…” to visit the Profiler and see a list of queries which may have caused the change.
Recommendations
Below the system resource metrics are “Recommendations to Check.”

DPM monitors your database and operating system configuration to detect deviations from established best practices. DPM also checks that your database is configured correctly for monitoring. Click on “View Recommendations” to be taken to the Best Practices page, where you can view information on any failed checks. We’ve added this to the Summary page so you can more quickly assess whether you’re getting the most from your system and DPM.