Inventory
The Inventory page includes three screens:
- Machine view, showing each monitored host individually
- Groups view, for MongoDB databases, showing database topography
- Agents view, to see the status of each agent and options to start, stop, and view logs
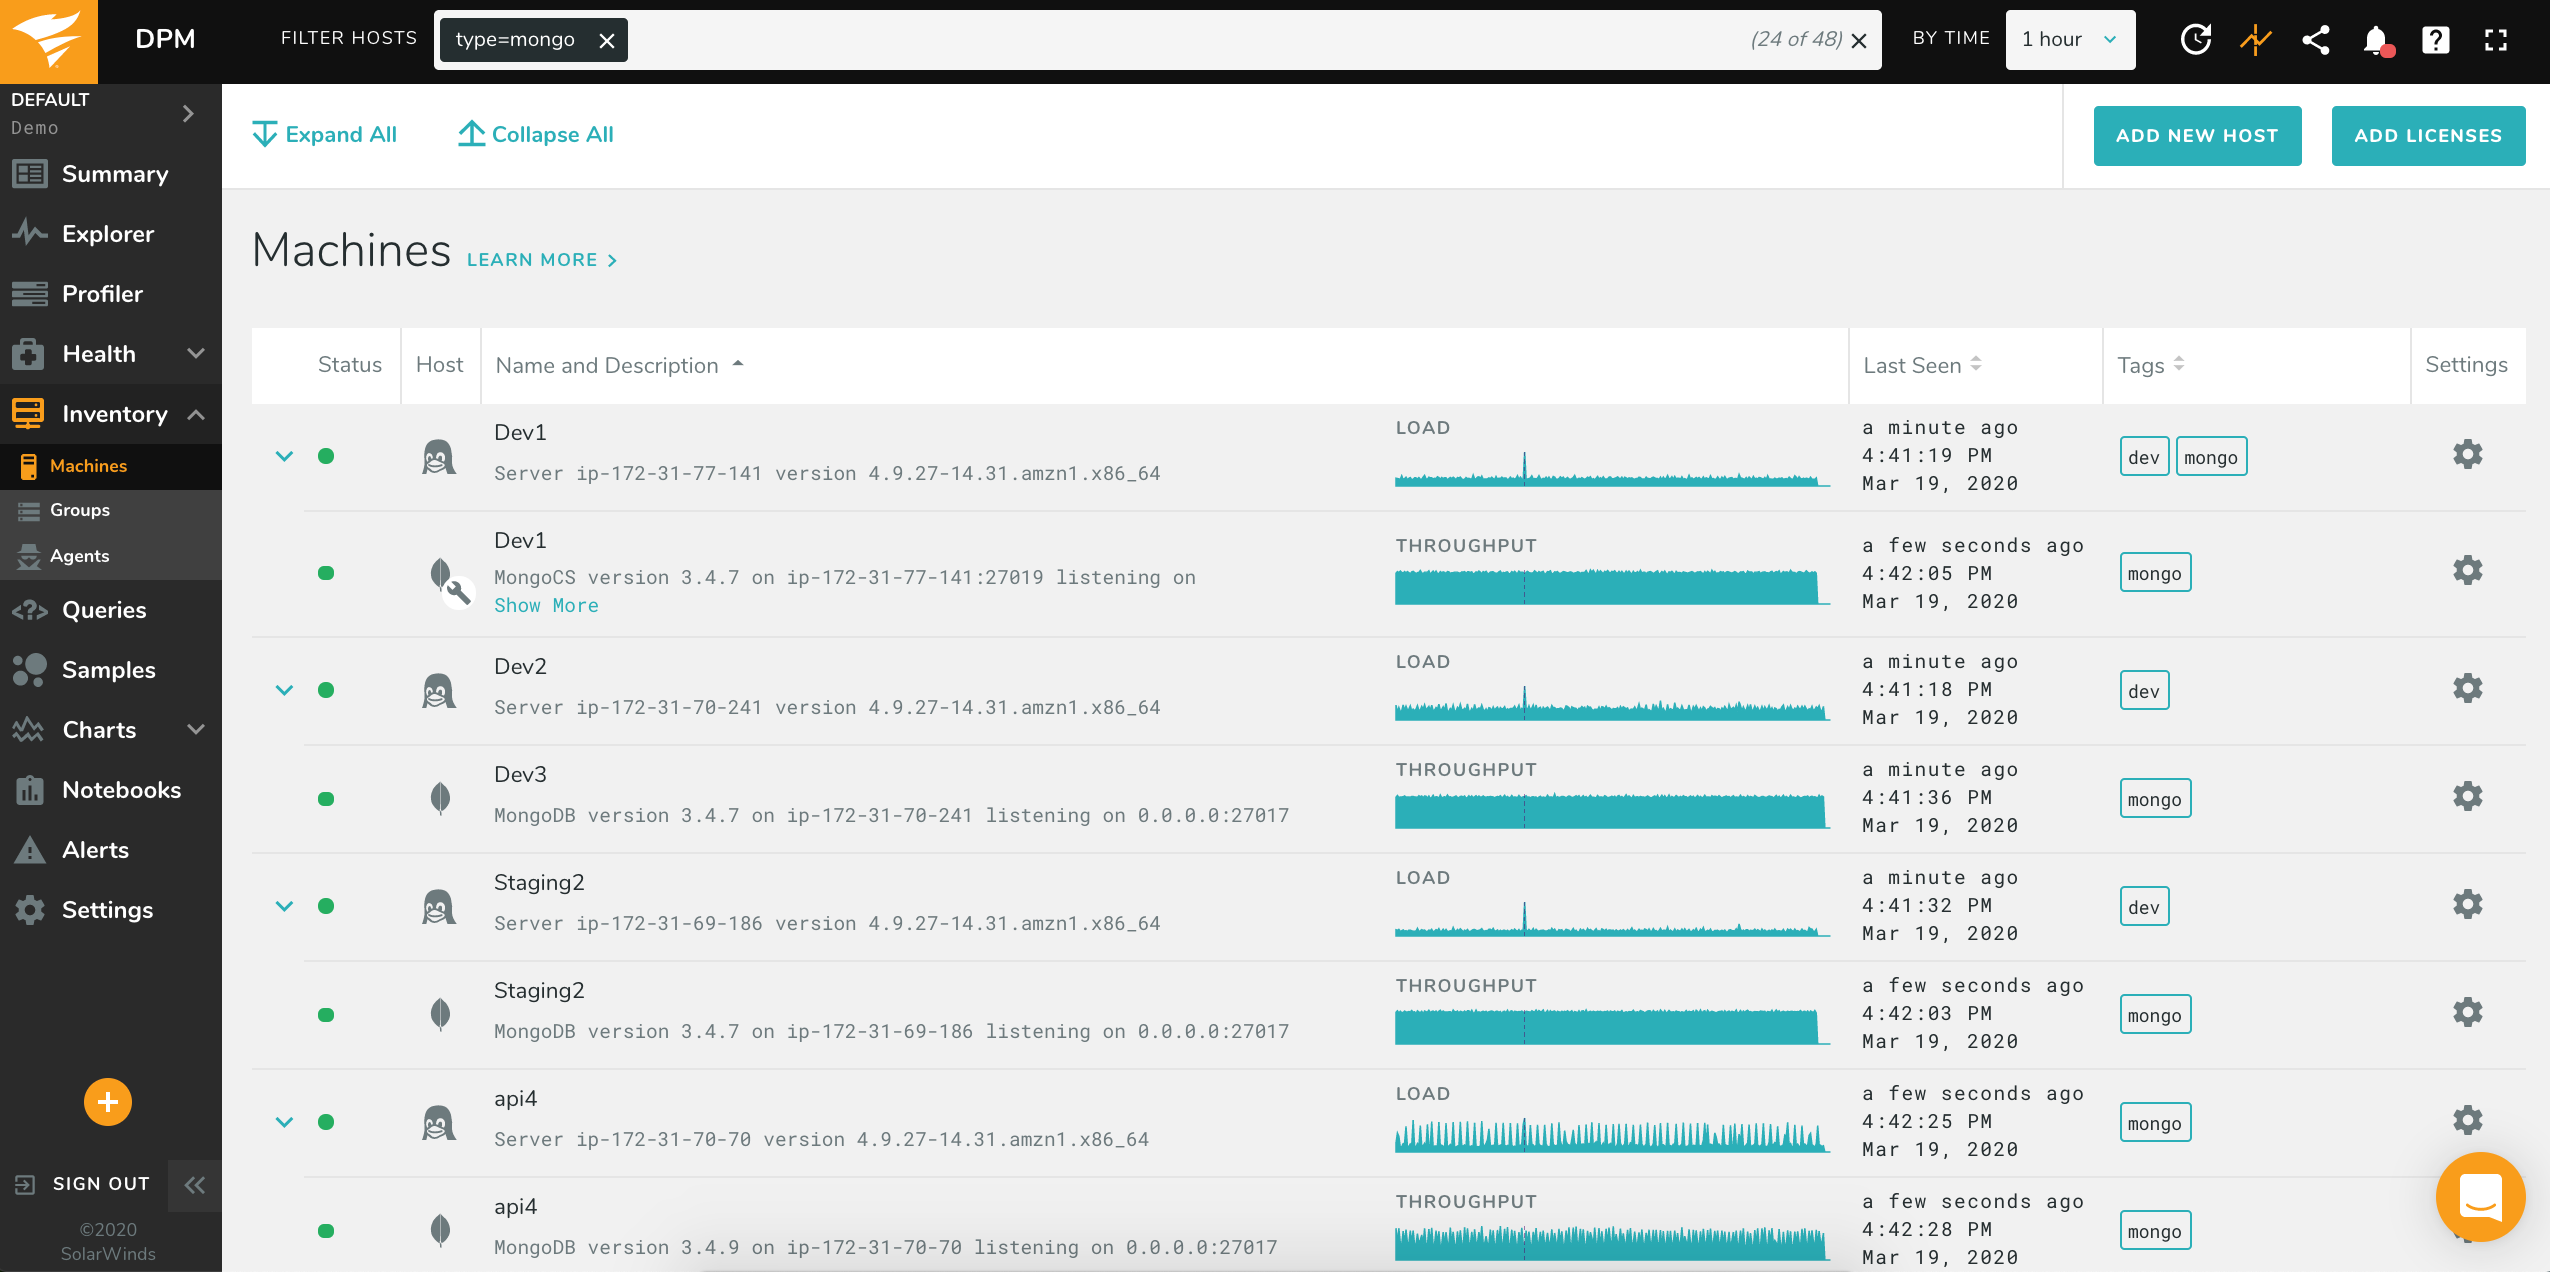
Machine view and Groups view show all registered hosts, with a sparkline summary of host activity (load for OS hosts, throughput for database hosts). You can edit a host’s name, description, tags, and authentication credentials.
In Machine view, the hosts are arranged in a parent/child relationship, where the OS host is the parent, and any database hosts monitored by that OS are children. These rows can be collapsed or expanded.
MongoDB hosts support Groups view, which displays each database and automatically detects whether or not is part of a sharded cluster or a replication set. In addition, it detects and displays if an instance is PRIMARY, SECONDARY, or ARBITER. Lastly, icons indicate whether the machine is a mongos, mongod, or config server. See the screenshot for examples:
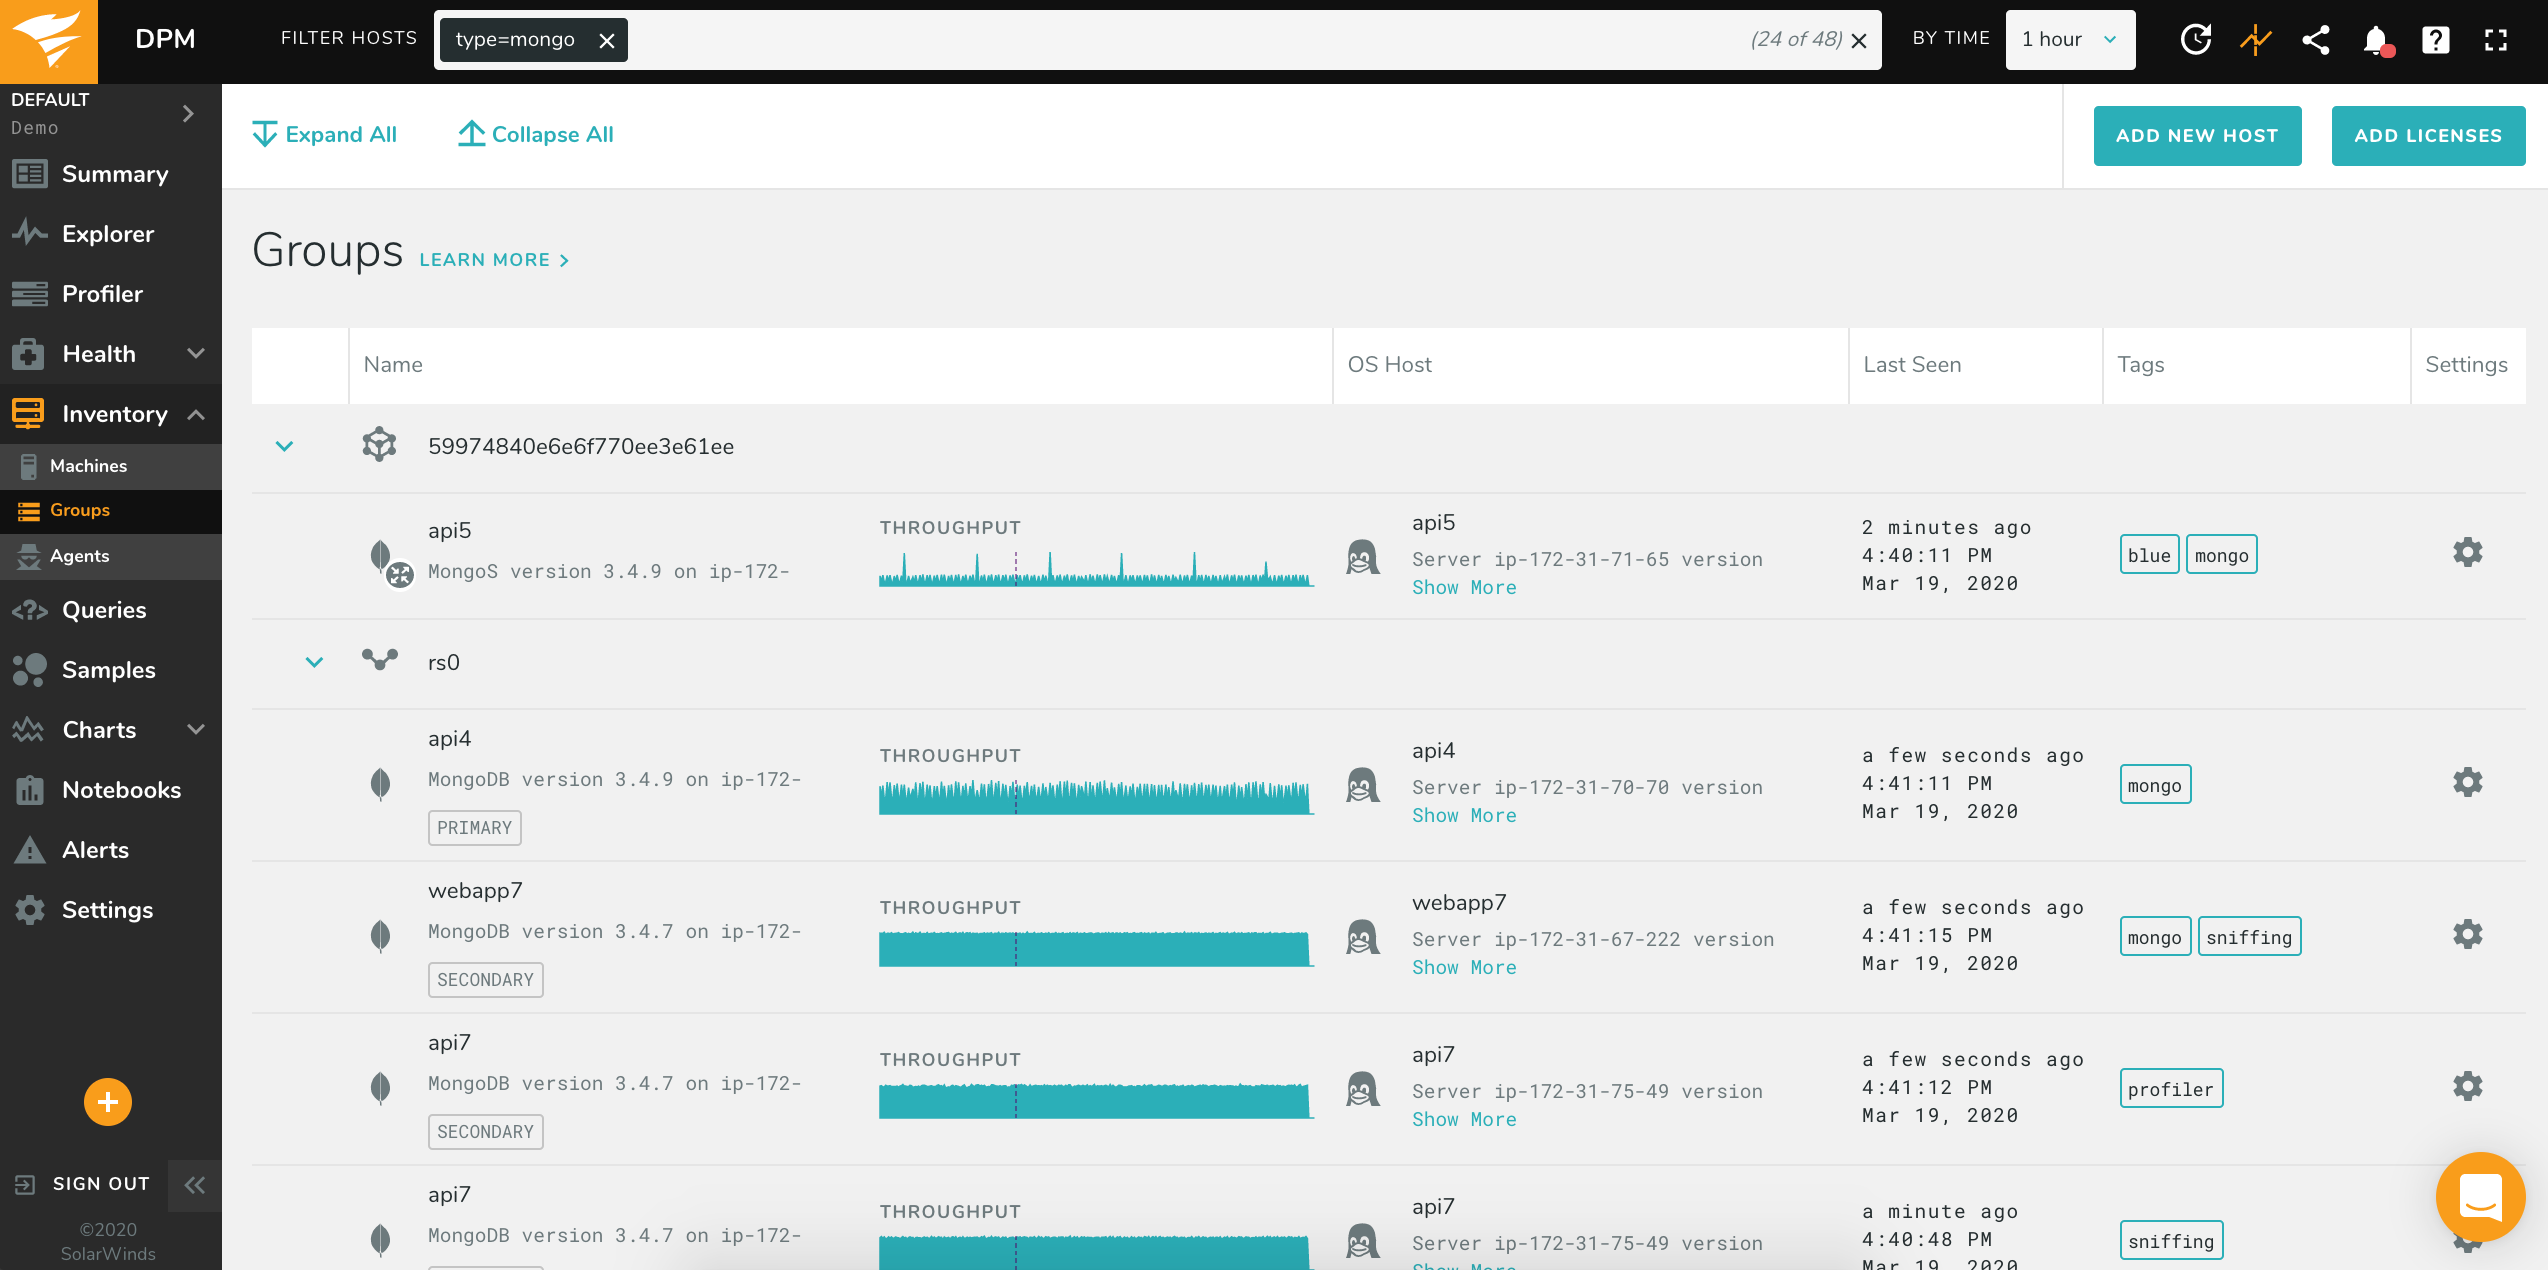
If you do not see your sharded cluster, check our troubleshooting page here.
Editing Hosts and Host Tags
There are currently four ways of editing a host’s information or add tags:
You can edit all the host details by clicking in the gear icon on the right of the list. A popup will appear that will let you edit all of the selected host information in one place.
If you want to edit hosts without leaving the list view, you can use the inline editing feature. Double click the name or description of a host to edit it. Then click “Apply” or “Cancel.”
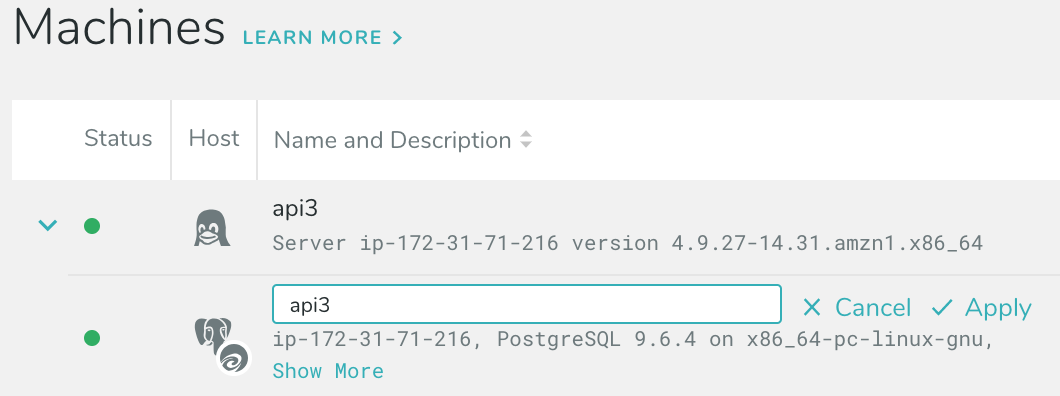
For the name and description is it also possible to double click the text to make it editable.
You can specify host tags at installation time through the install script by adding the option
--host-tagsand a comma-separated list of tags; for example,sh install --token --autostart --start-now --proxy auto --host-tags foo,bar. Spaces in tag names are not currently permitted using this method.You can also specify host tags in any of the metrics agent configuration files. For example, to tag a PostgreSQL database, update
/etc/vividcortex/vc-pgsql-metrics.confto include"host-tags":"foo,bar". To tag an operating system, usevc-os-metrics.conf. To tag all hosts, edit yourglobal.conf. Spaces in tag names are not currently permitted using this method. Read more about using configuration files, including their correct format, in our configuration documentation.
Using AWS Tags
For clients using AWS, we can automatically sync your EC2 and RDS tags into DPM. For example, if your RDS host is tagged with server_env and the value is stage, we can automatically tag that host in DPM with server_env=stage.
To enable, update or create a metrics agent configuration file to include "enable-cloud-tags":"true" and "tags-sync-mode":"merge" or "tags-sync-mode":"mirror". merge will add the AWS tags to any other tags you add to a host; mirror will overwrite any other DPM tags so that the host has the same tags in DPM and AWS. (No tags in AWS are ever changed by DPM.)
To enable this for your MySQL RDS or PostgreSQL RDS instance, update your vc-mysql-metrics.conf or vc-pgsql-metrics.conf file. To enable this for an EC2 instance, update vc-os-metrics.conf. Note that when applied to an EC2 instance, any databases installed on that host will also be tagged.
Agents Interface
The Agents interface is available by clicking Agents in the top-left of the Inventory page. This gives you control over agents, with the ability to stop, start, and restart agents, as well as view recent logs.

The page shows health and resource consumption of agents during the selected time interval. If an agent isn’t healthy, you’ll see a yellow warning icon instead of the green OK circle. Check the Events page if that’s the case, to find more information about the problem. Additionally, you can look for issues by viewing the recent log for each agent. Click the gear icon on the right side of the page and select how much of the log to fetch.
The sparklines show total resident memory and total CPU (user + system) for the proceses. The resource consumption shown is the combined total for all agents of that type on the server.