Events Page
Events are information that Database Performance Monitor has either detected or inferred about various parts of your system, such as hosts and queries. Events can be used to create Alerts, and you can view Events overlaid on charts and sparklines.
Here are some examples:
- A disk becomes full or nearly full
- A server configuration variable changes
- A query returns an error to a client application
Click here for a complete list of events which DPM will detect automatically in your environment.
The Events interface is a powerful interactive feature for discovering timely information about systems, allowing you to swiftly filter, select, and drill down from a summary to details. To view Events, click on “Health” in the left-hand navigation, then click “Events” at the top of the window.
Here is an overview of the page:
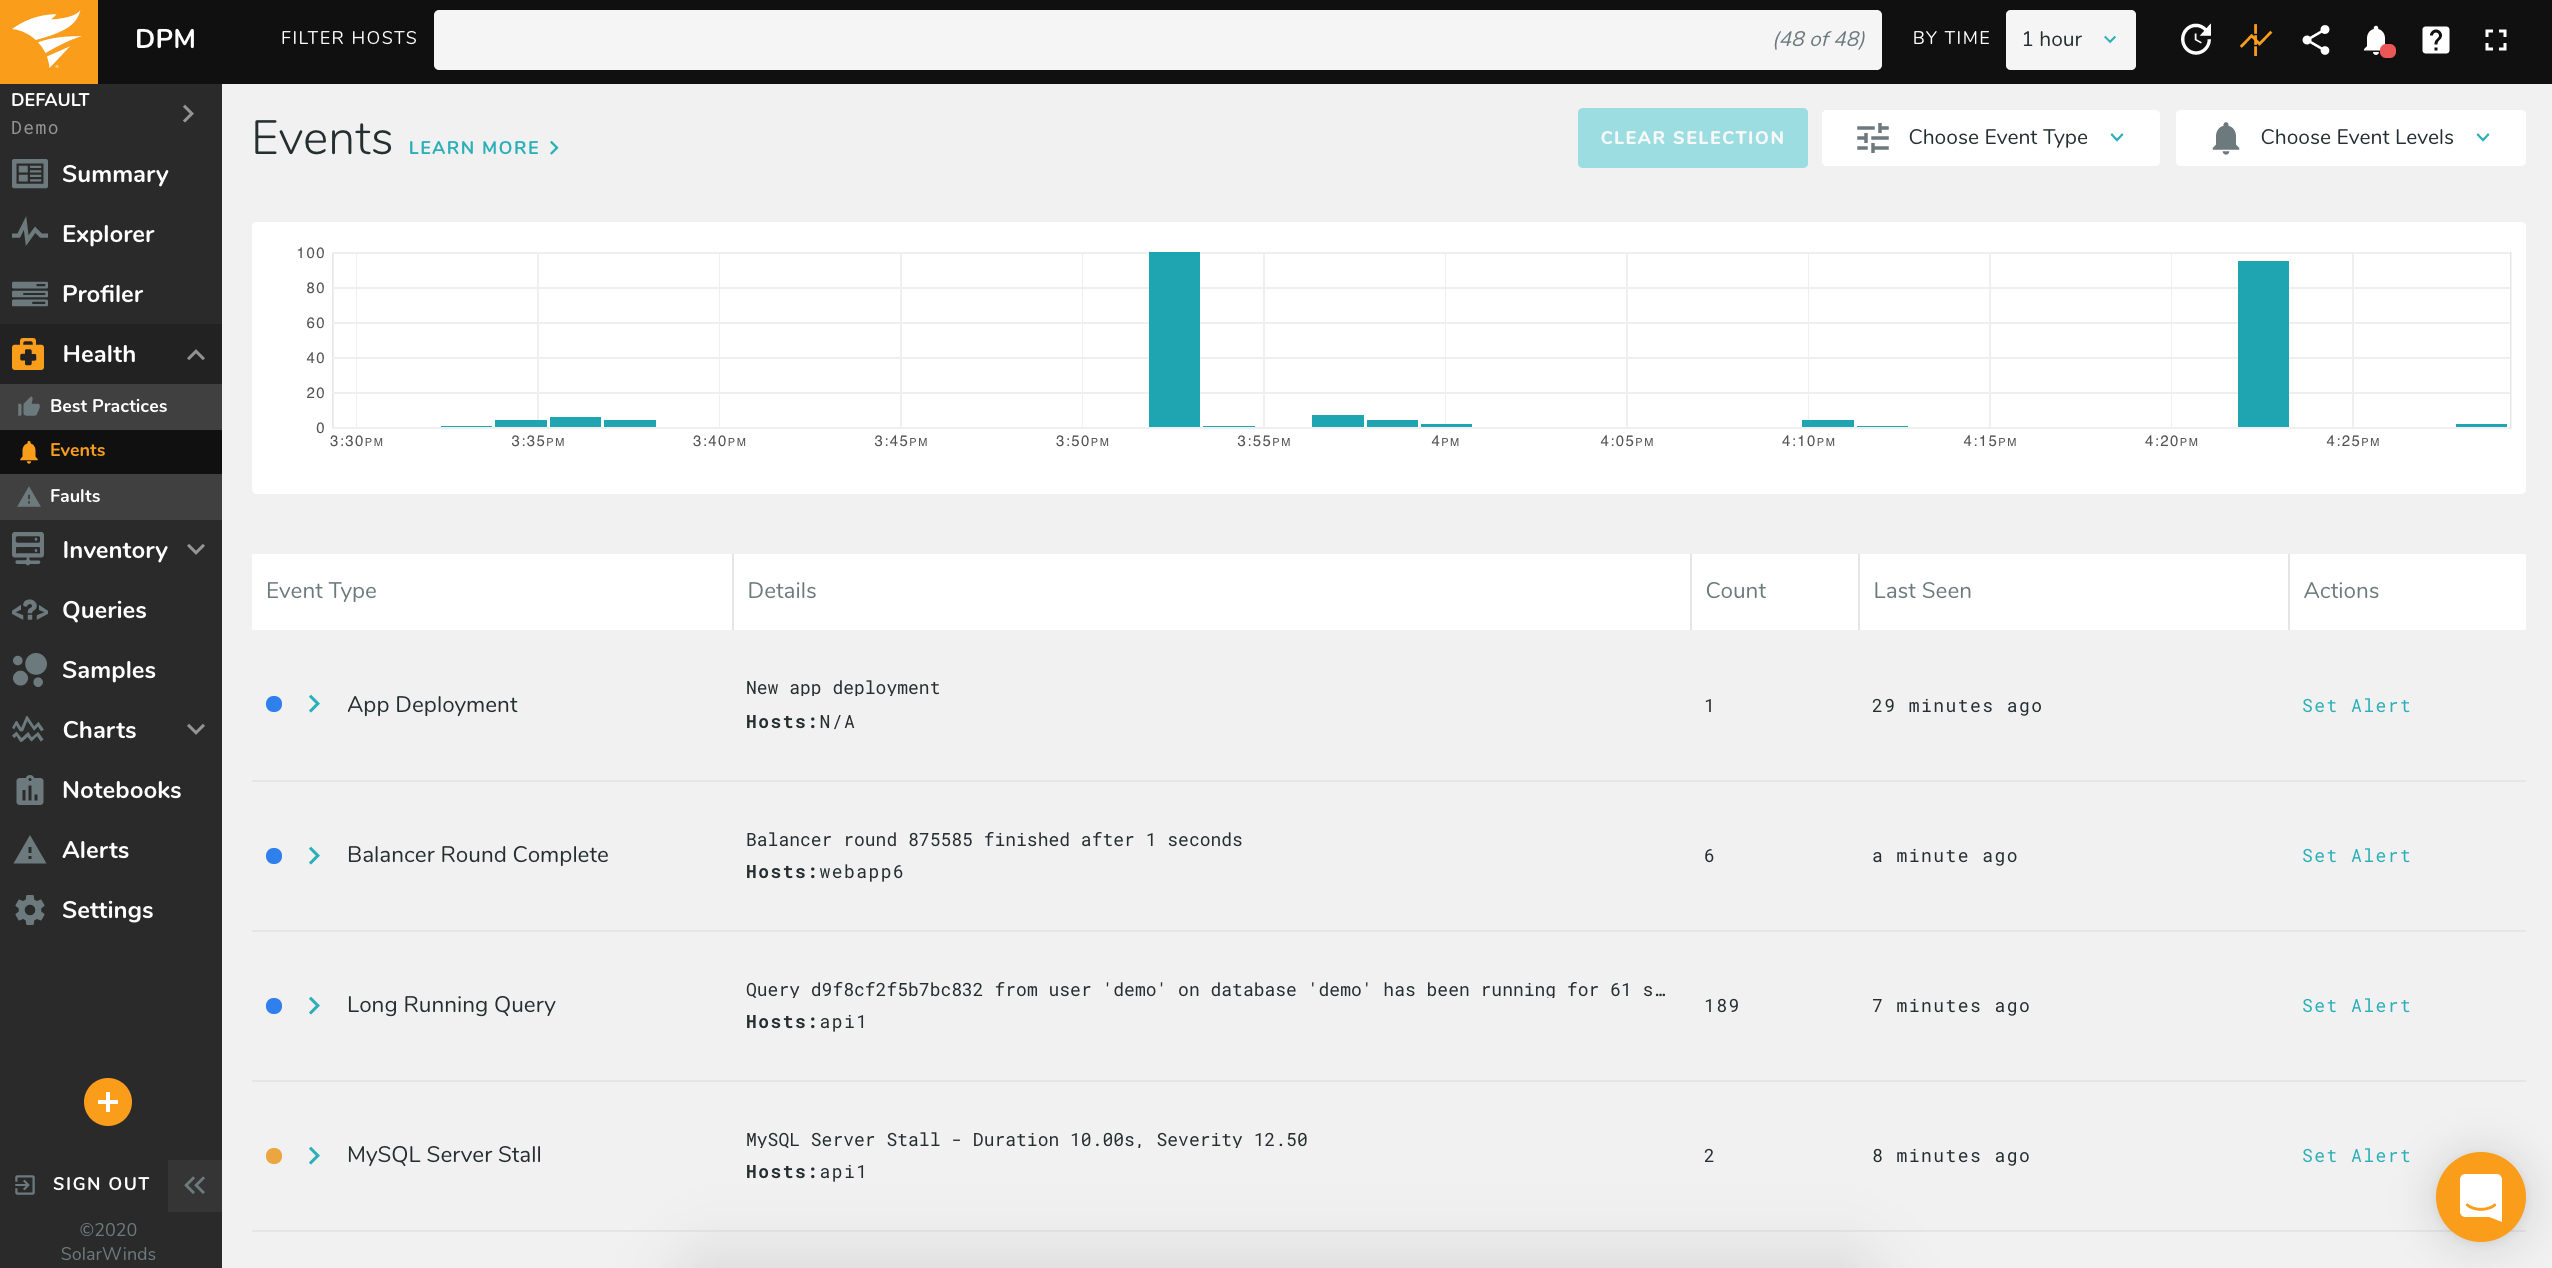
You can use the toggles at the left to enable or disable events by severity (informational, warning, or critical). You can see a timeline of the number of events at the top of the page, as well as a category selector. In the main body of the page you see the events, with similar events grouped together.
Use the category selector to toggle display of various types of events:

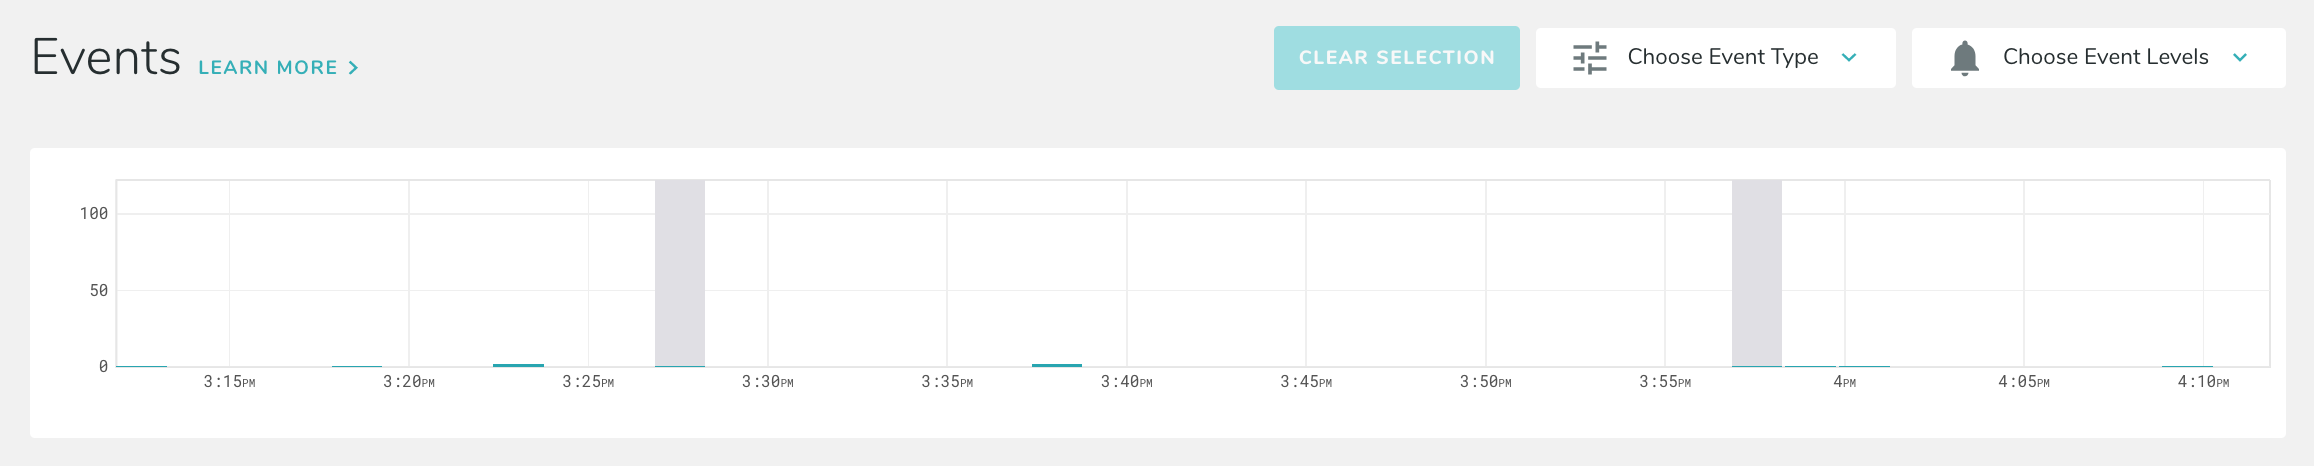
After changing the category or severity selectors, the timeline shows the filtered subset of events in blue, with the total set of events in gray:
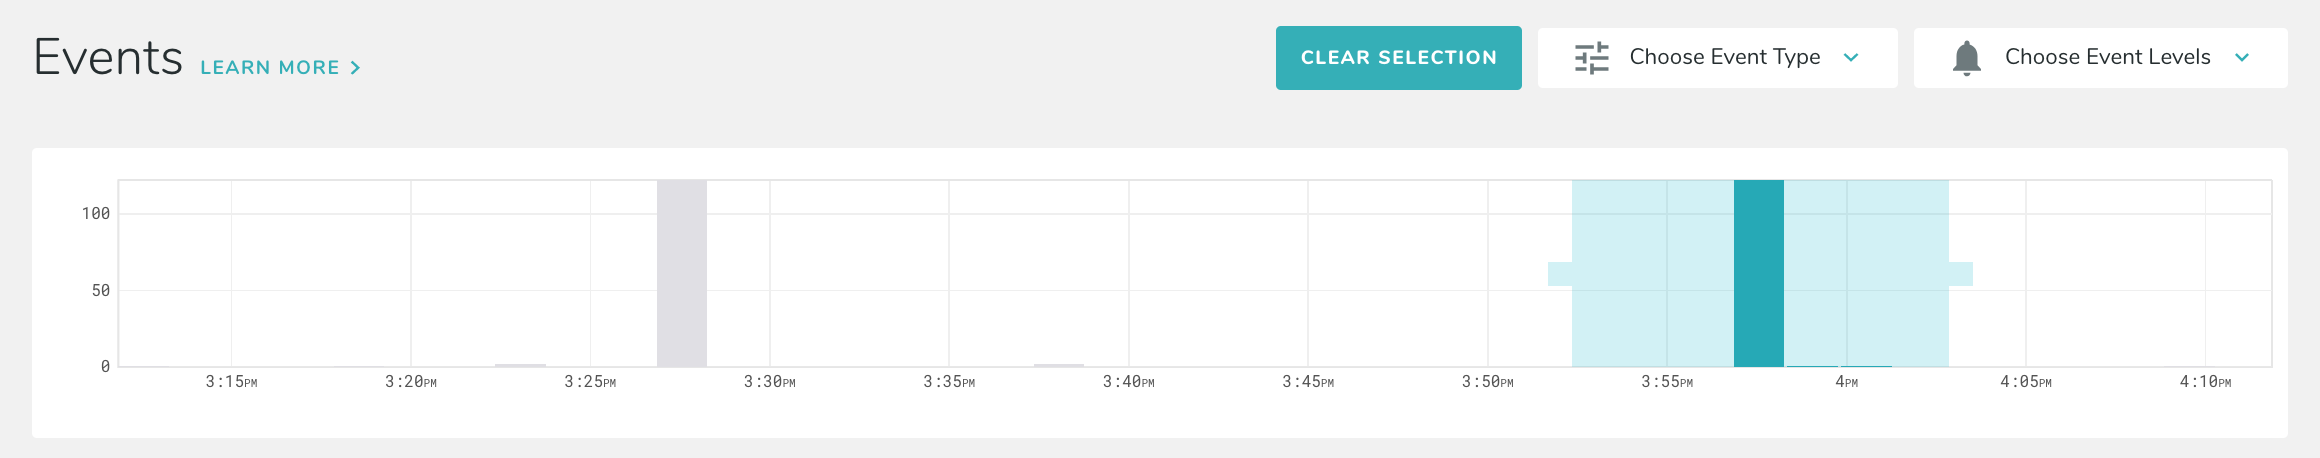
You can also click and drag on the timeline to select a subset of the time range. This selection is temporary and doesn’t update the time range in the top-right time selector. You can drag and resize it to filter events in realtime.
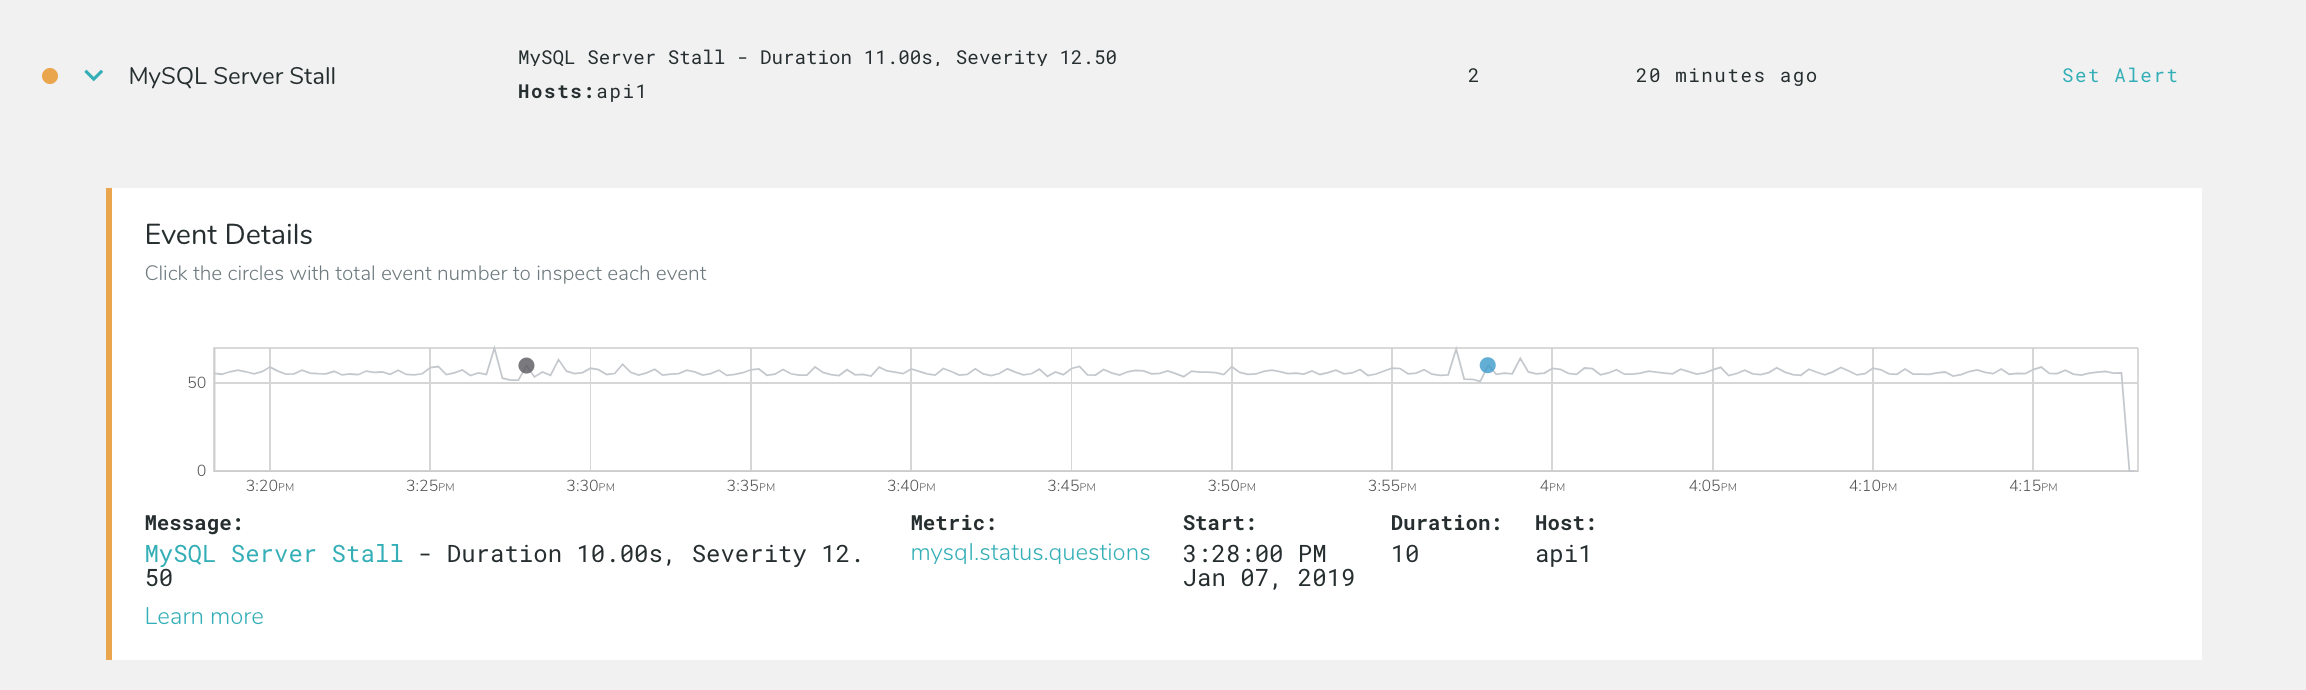
Events with similar messages are grouped together into rows in the main body of the page. Each row can represent one or many events. Clicking on a row expands it and lets you select the individual events contained within it to see their details. If a metric is associated with the event, you will see a sparkline chart of that metric over the time range in the time selector.