Explorer, Notebooks, and More
We’ve added two brand new features to VividCortex to make identifying, resolving, and documenting issues even easier: Explorer and Notebooks. We’ve also updated our Dashboards interface, improved navigation in the app, and more.
Explorer
Explorer combines the power of the Profiler with database and system metrics, allowing you to compare both sets of data on the same screen with the same time and host filter selections. This makes it easy to see what caused a change in performance, such as a spike in CPU Utilization, or increase in database latency.
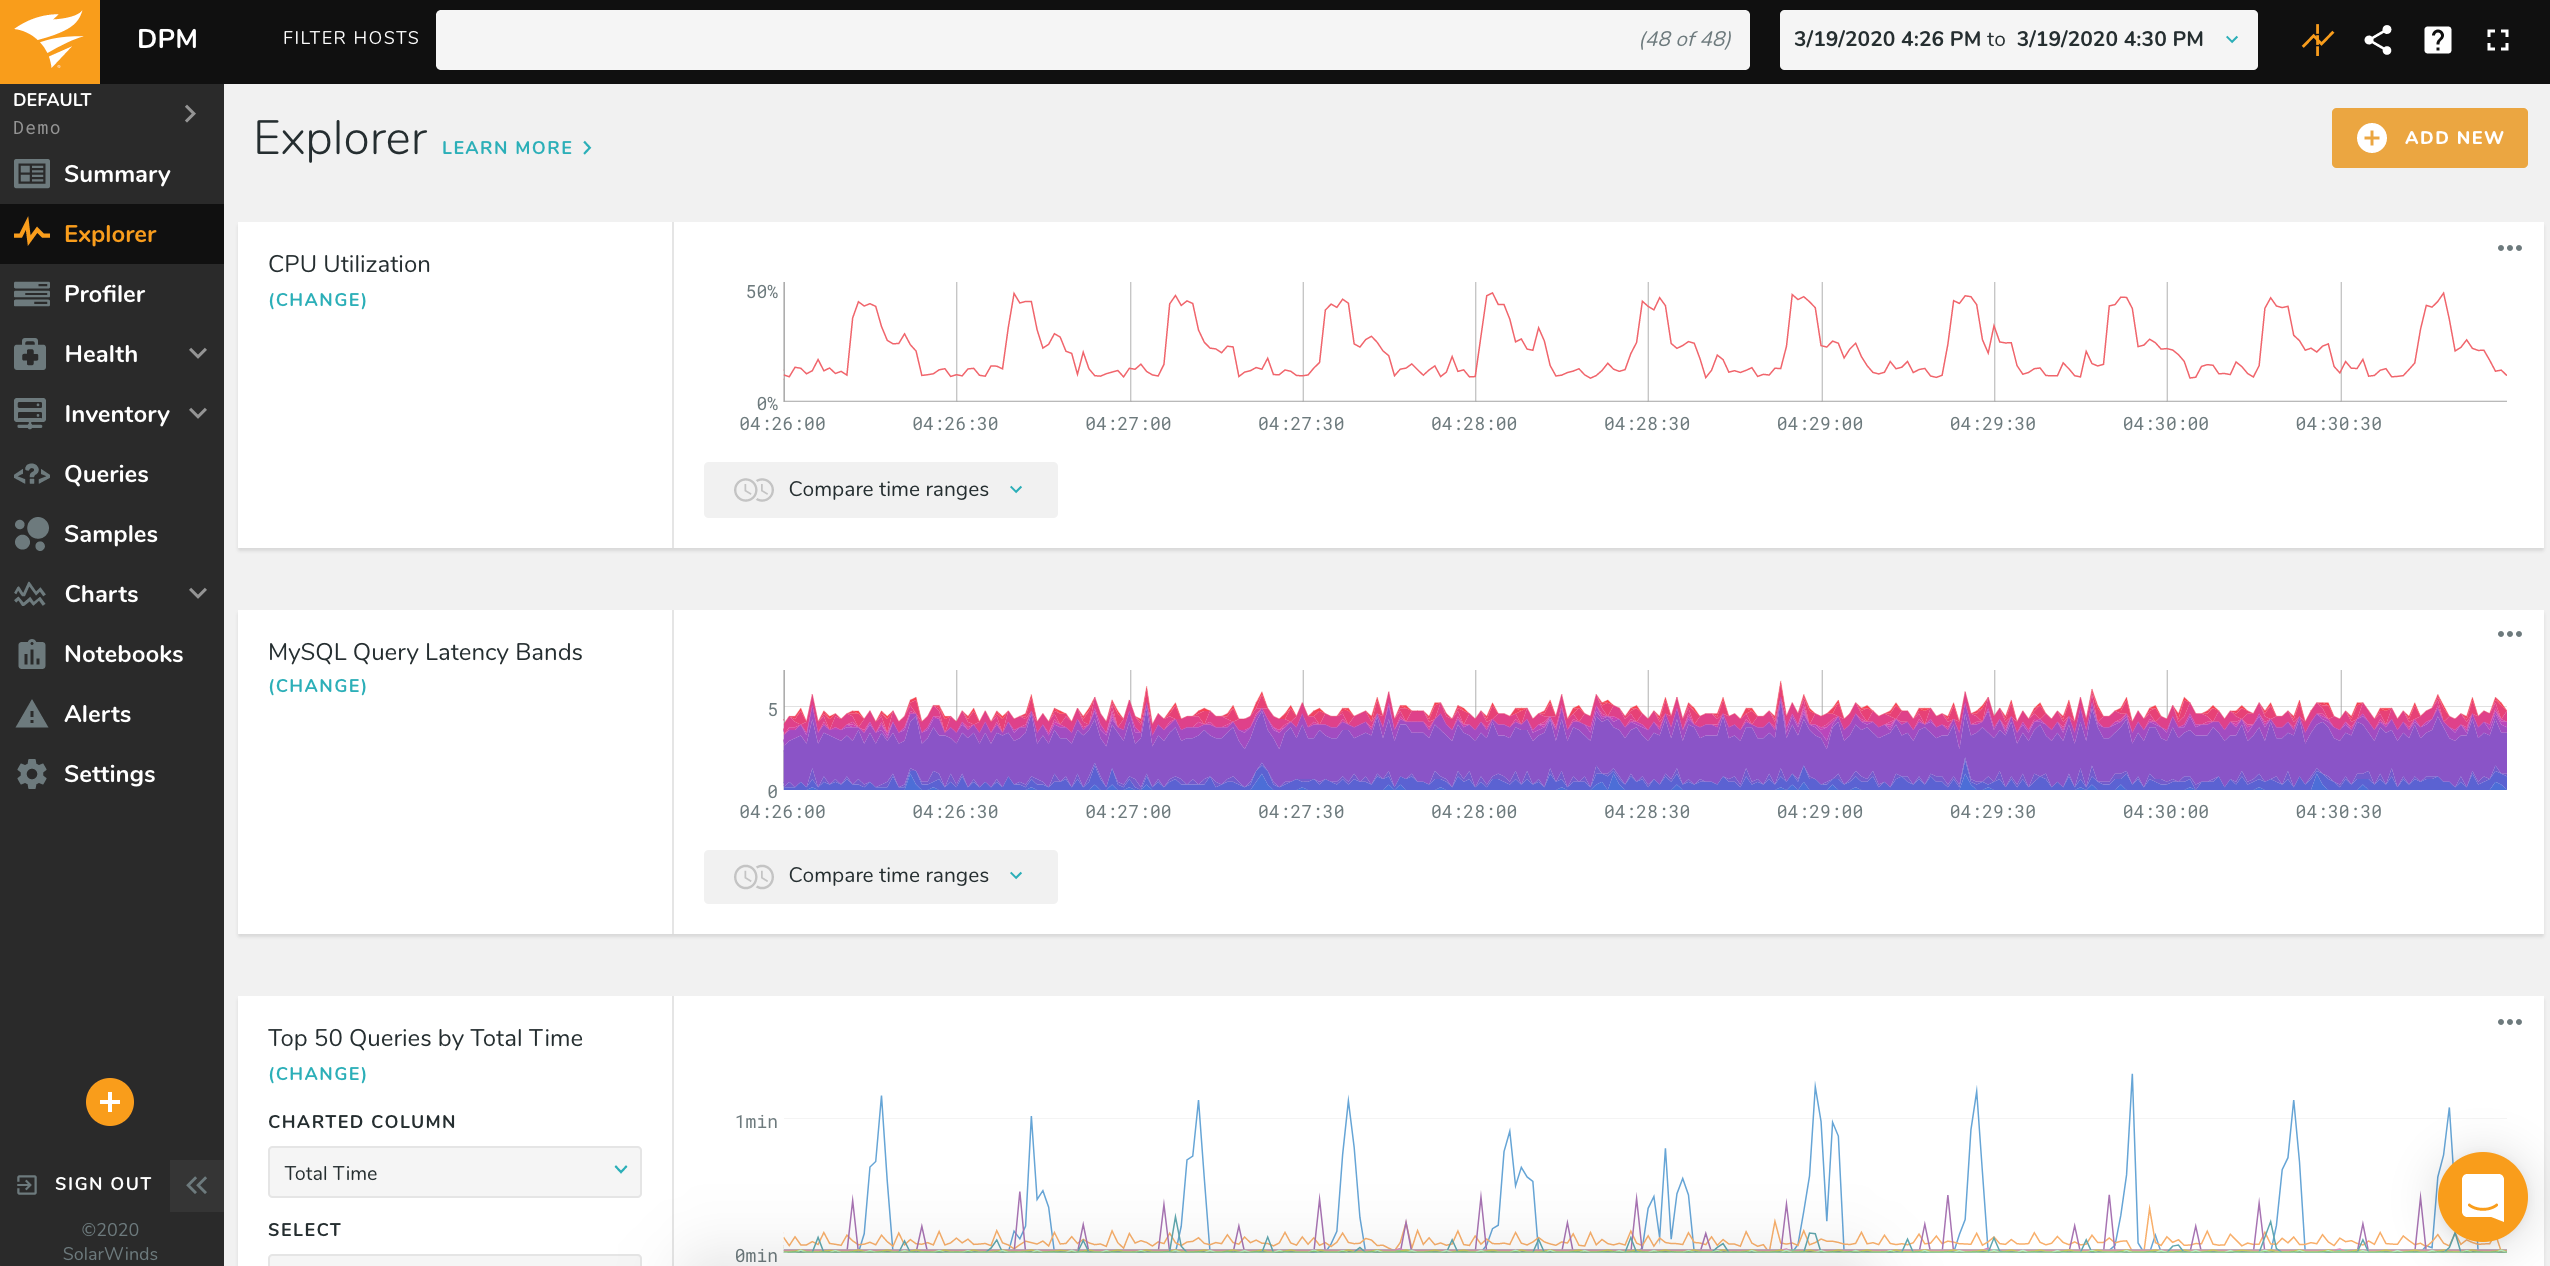
At the top of the screen you select a system or database metric to compare against. Below it you’ll find the datasets you’re familiar with from the Profiler. You can interactively add and remove columns from your analysis, chart different columns of data to see correlations, and remove irrelevant rows from the chart.
For complete documentation about Explorer, check out our Explorer docs.
Notebooks
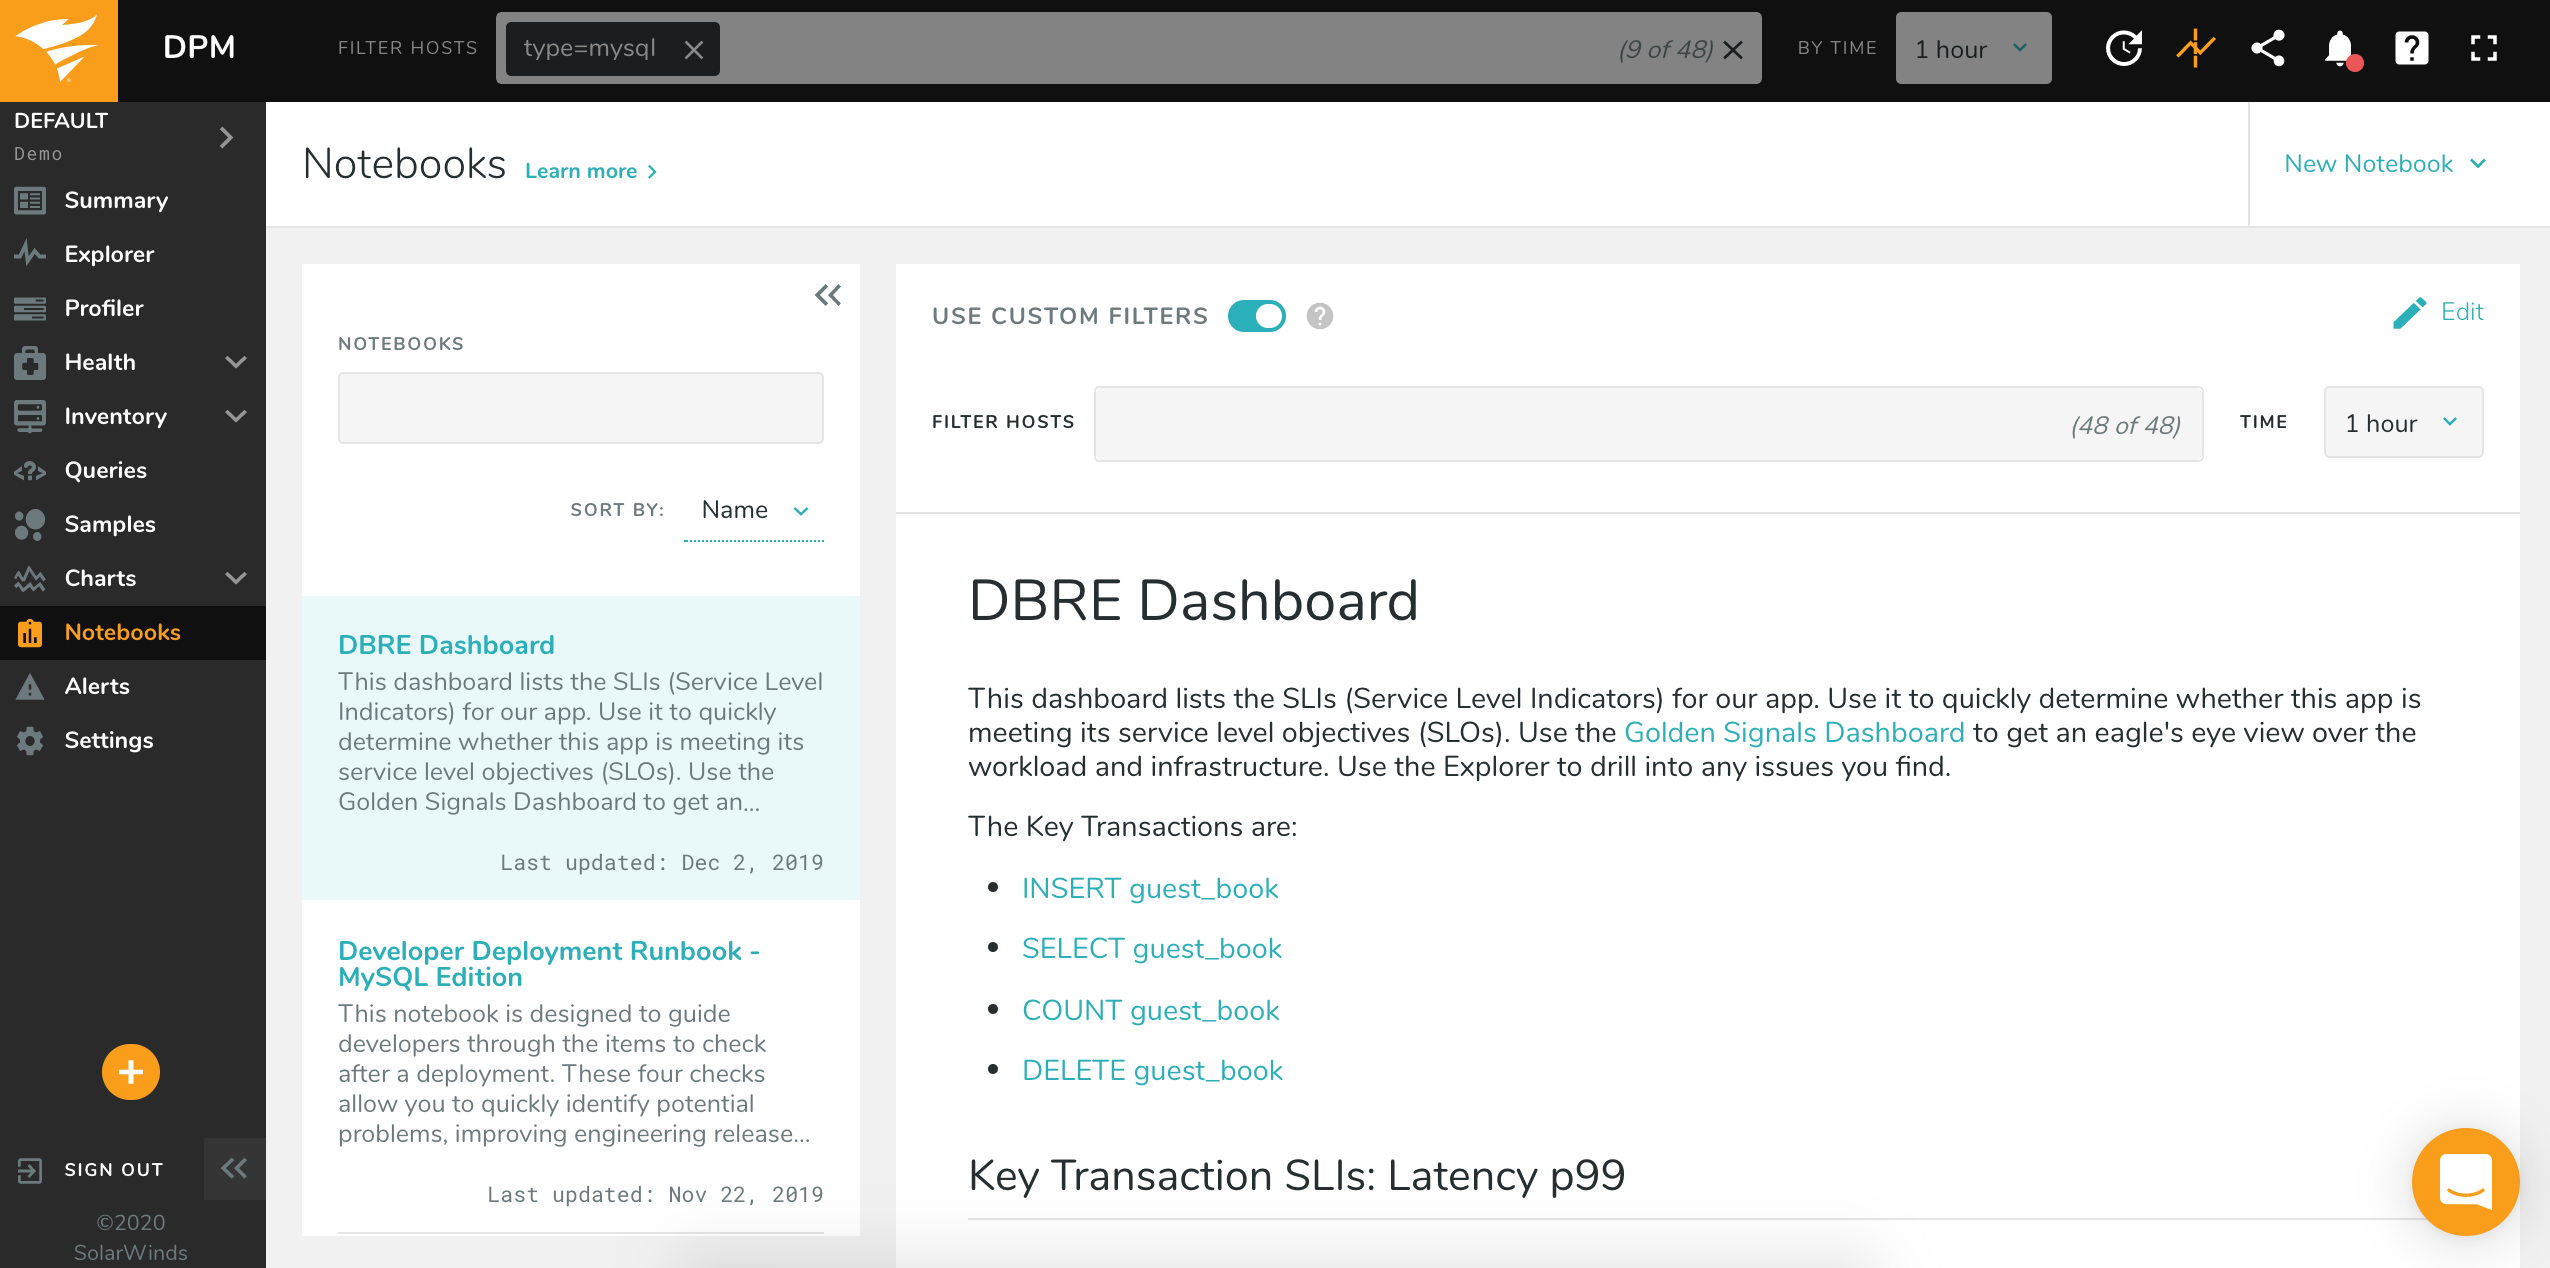
Notebooks allow you to add rich context and commentary to VividCortex charts including text, code snippets, links, and images, all in Markdown syntax. Notebooks make it easy to reuse content and quickly generate reports on new events including outage post-mortems, diagnosis narratives, and runbooks.
Check out our Notebooks documentation for more details.
New Charts Dashboards
Dashboards can now be built and edited using a simple Markdown-based syntax. This makes it easier to add charts to, and remove charts from, a custom Dashboard. New to VividCortex is the ability to plot any metric or combination of metrics, including any custom metrics you’re sending to the API. Additionally, it is now possible to see a breakdown of a metric (or a chart) by host. For example, you can view CPU Utilization by host, rather than as an average across all of your hosts.
For complete documentation about the new interface, along with a complete set of example syntax, see our Dashboards documentation.
Other New Features
In addition to the big changes above, we’ve also added a few new commonly-requested features:
Improved navigation: We’ve made it easier to quickly access the page you need by moving sub-pages into the left navigation. For example, you can go directly to the Metrics page without first needing to visit the Charts Dashboards.
Disable OS metrics: Clients monitoring their database remotely (“off-host” installations) can now opt to disable the OS metrics from the monitoring host. To do this, create (or edit) a configuration file for the vc-os-metrics agent, /etc/vividcortex/vc-os-metrics.conf. Add the option "disable-system-metrics":"true" and restart the agent.
Long-running query alerting for MongoDB: You can now enable long-running query events for MongoDB queries. When enabled, this will generate an Event if we detect a query running for longer than a user-defined threshold. You can then trigger an Alert on this Event. To enable, create (or edit) a configuration file for the vc-mongo-metrics agent, /etc/vividcortex/vc-mongo-metrics.conf. Add the option "long-running-event-threshold":"Ns", where N is an integer number of seconds. For example, to generate an event for any query running for longer than one second, you would use "long-running-event-threshold":"1s".